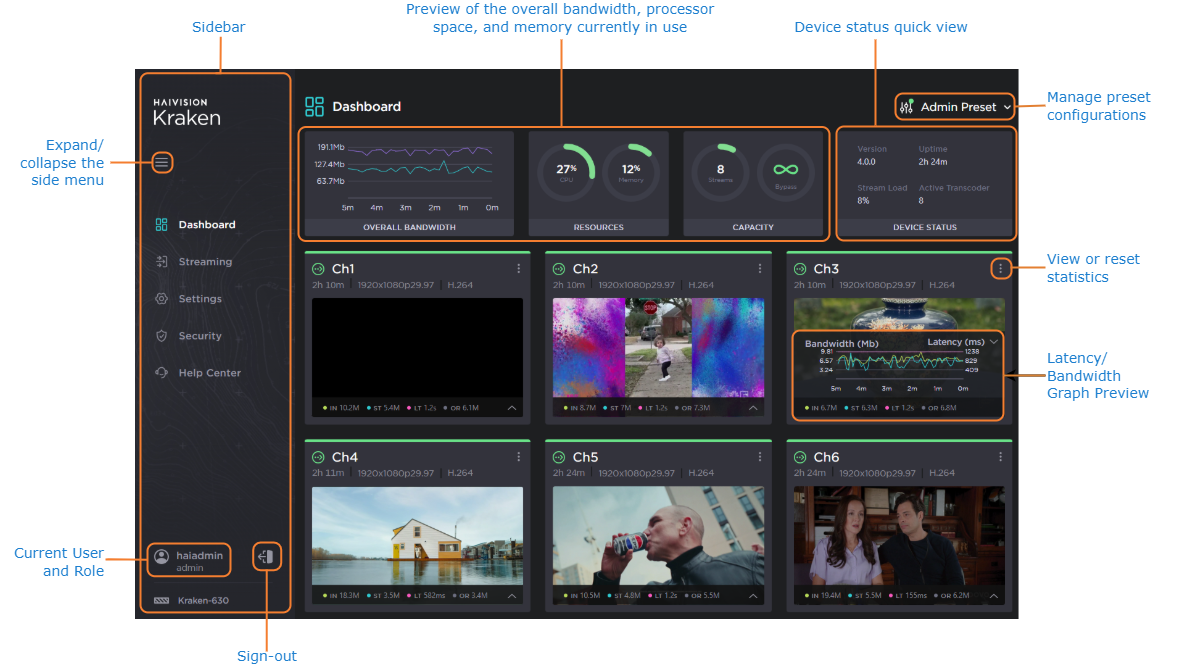
Once you have successfully signed in, the Kraken Web interface opens to the Dashboard. From here, you can use the Navigational Menus to access the Streaming, Settings, and Security sections. For further details on stream and system monitoring from the Dashboard, see Navigating the Dashboard.
Select Help Center from the sidebar to access online help. You will be re-directed to the Haivision InfoCenterwebsite, which contains the Kraken documentation. See How to use the InfoCenter for tips and tricks for browsing the site.
Note
To access the most up-to-date documentation, Kraken routes users to documentation resources within doc.haivision.com.
For disconnected environments (i.e. if no external internet connection is available), the Kraken UI checks for an asset on the documentation portal, specifically 'https://assets.doc.haivision.com/assets/images/favicon.png', and will guide users to the local offline help when this asset is unavailable.
Click theSigning Out icon to sign out of your current session.
Kraken provides pop-up notifications for most actions taken from the web interface.
These notifications appear on the top-right of the screen and confirm/describe the status of the action. It is important to take note of these pop-ups, as some may contain messages or alerts that require user action.
System Monitoring
The dashboard provides users with key system information, including:
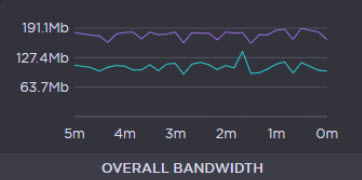
An Overall Bandwidth chart, displaying the overall bandwidth in Mb for Inputs (purple) and Outputs (teal).
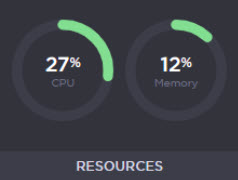
The percentage of CPU and Memory Resources being used.
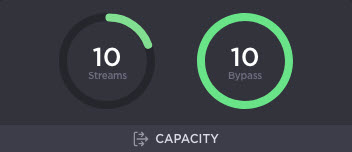
A Capacity Card, demonstrating the Stream and/or Bypass capacity load.
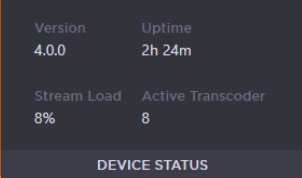
The Device Status Information, including: Version, Uptime, Stream Load, and Active Transcoder.