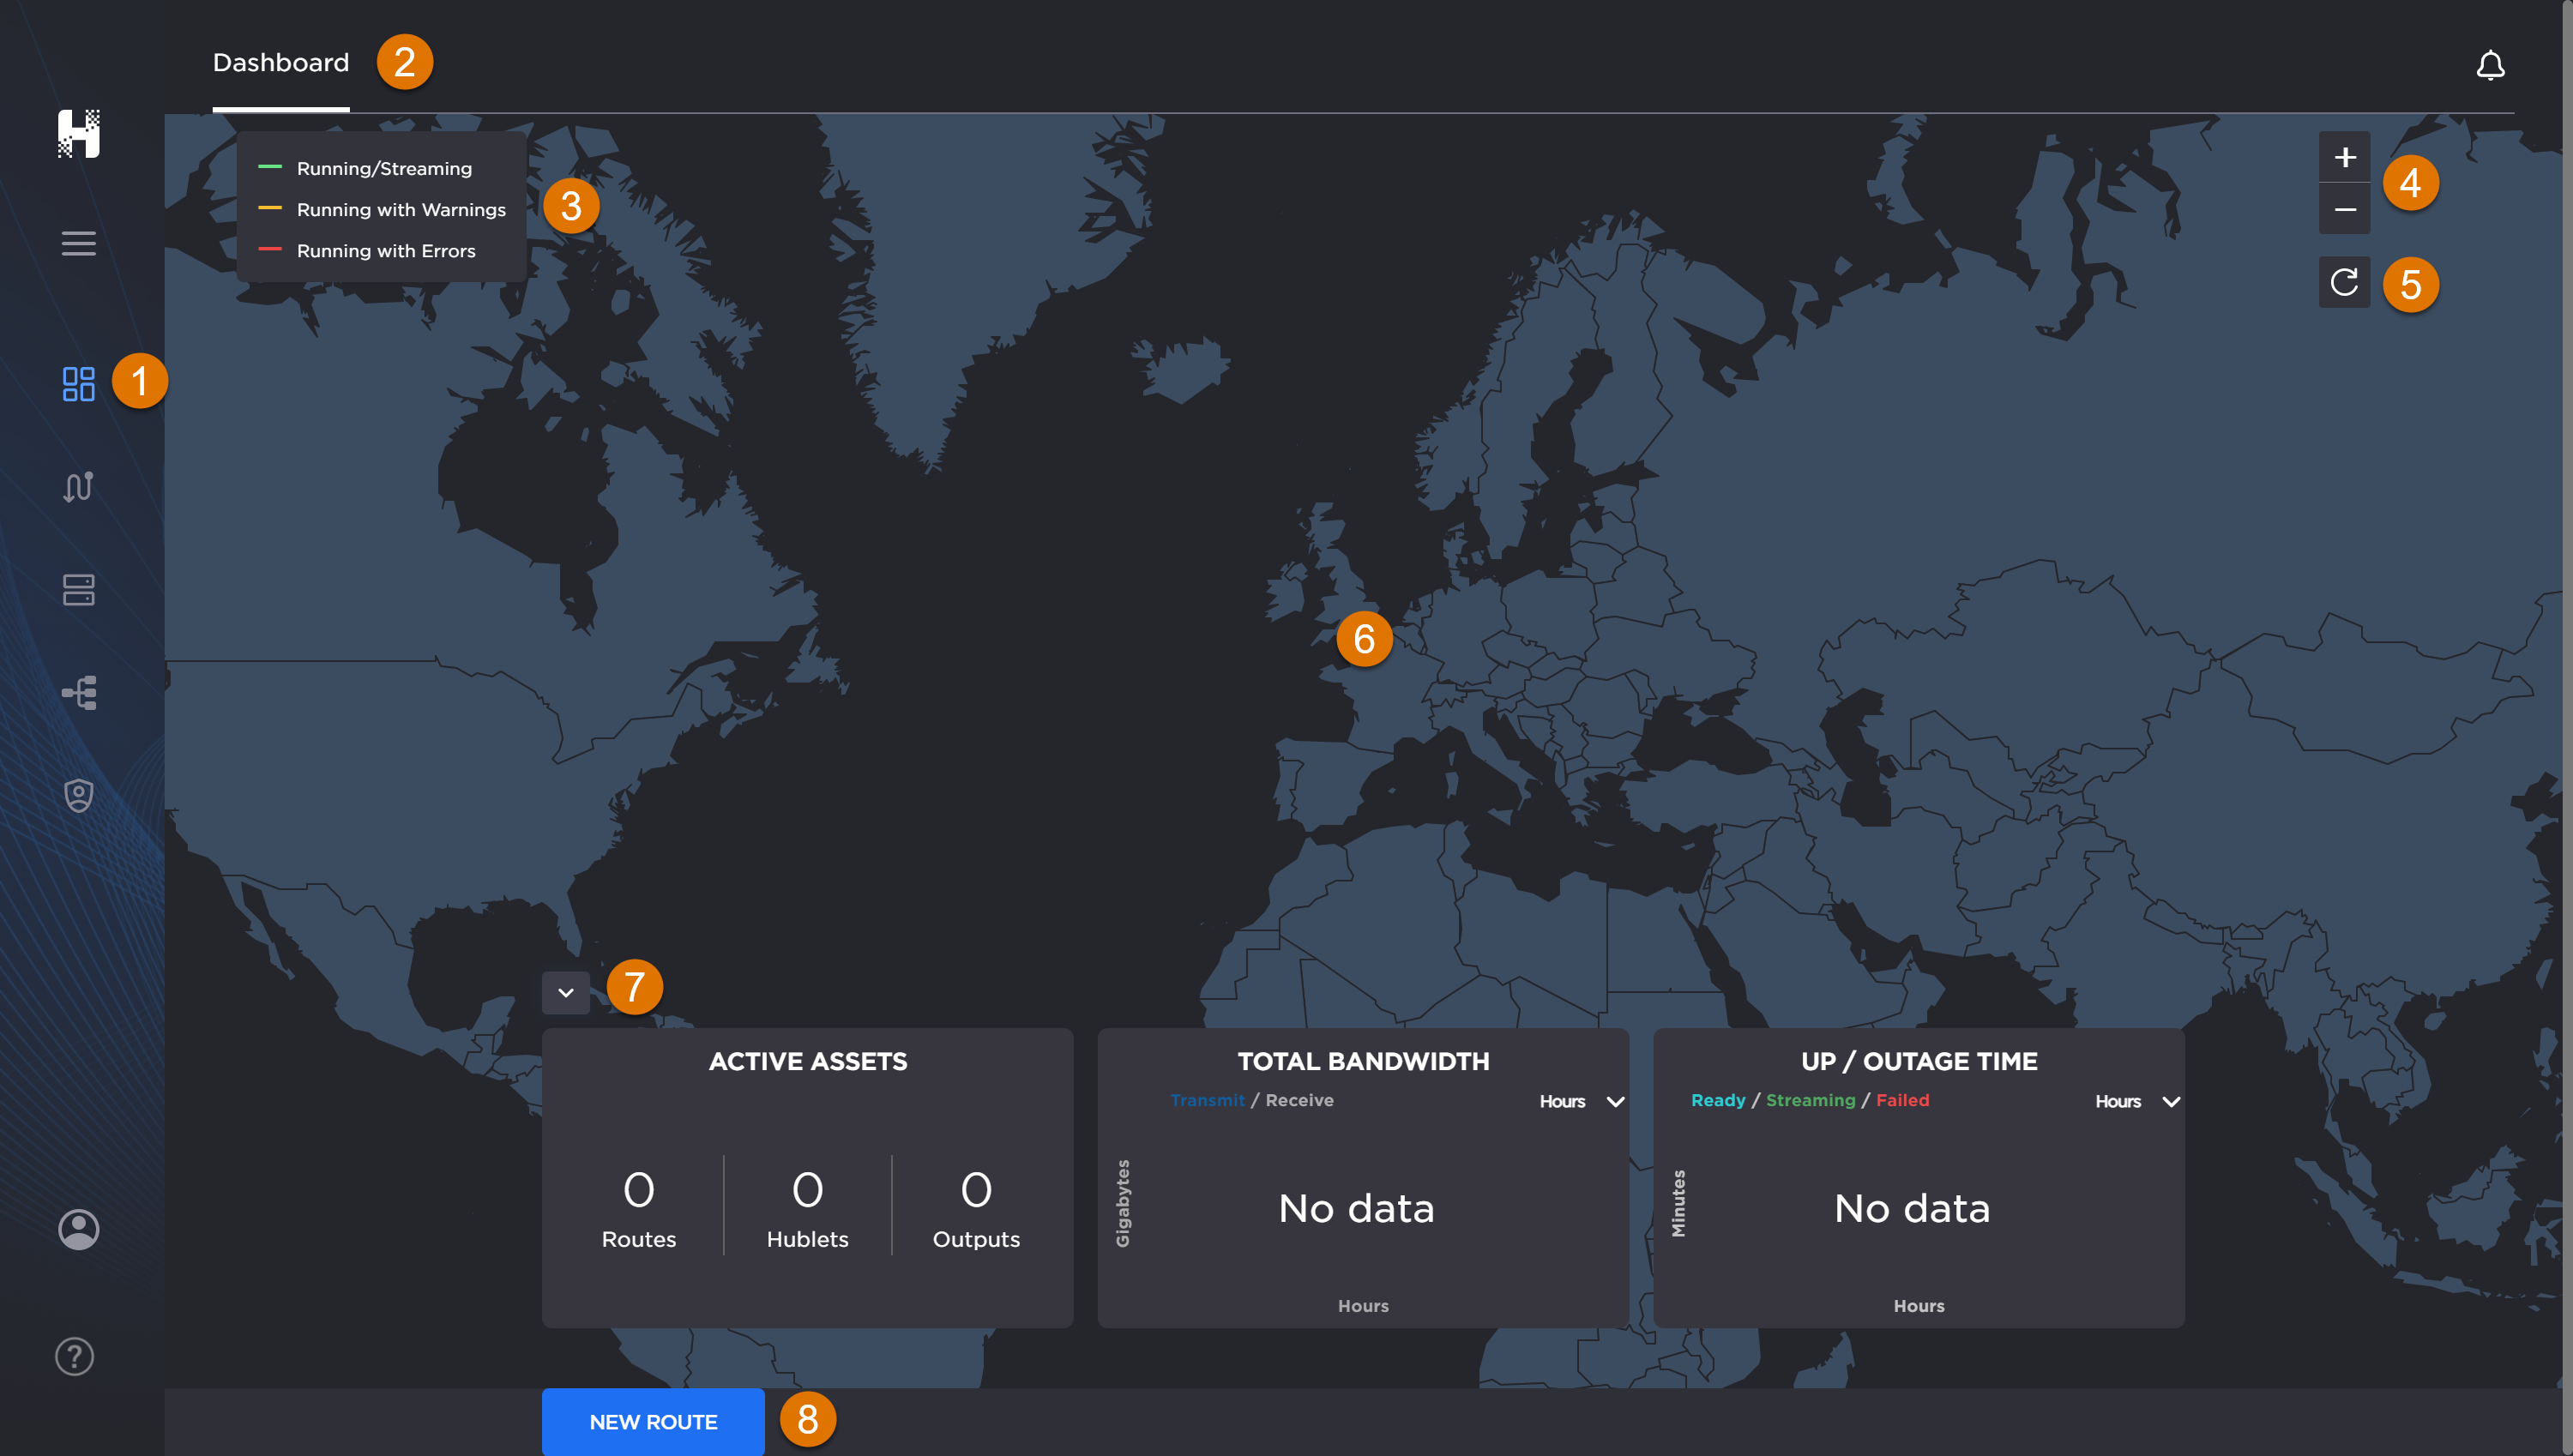
Control Center Screen
The 
To view the Dashboard:
Click the
 Control Center option
  on the navigation sidebar to get to the dashboard from anywhere in the interface.

Haivision Hub Control Center dashboard labeled.


Other Dashboard actions:
Repositioning the Global Map – click and drag the global map
 to reposition it.
Zooming the View – Use the Zoom controls
 to zoom in and out on the global map.
Reloading the View – Use the Reload control
 to reload the current map.
Viewing Datacenter Info – Hover over any
 on the map to reveal info on name, routes, outputs, and conflicts. Only datacenters with running routes are depicted with
  .
.Collapsing/Expanding Analytics Panels – Use the
 icon
icon  to toggle between collapsing and expanding the panels.
Creating a Route – You can click the New Route button
 in the action bar to kick off creating a route. See Creating a Route for more information.
Related Topics
