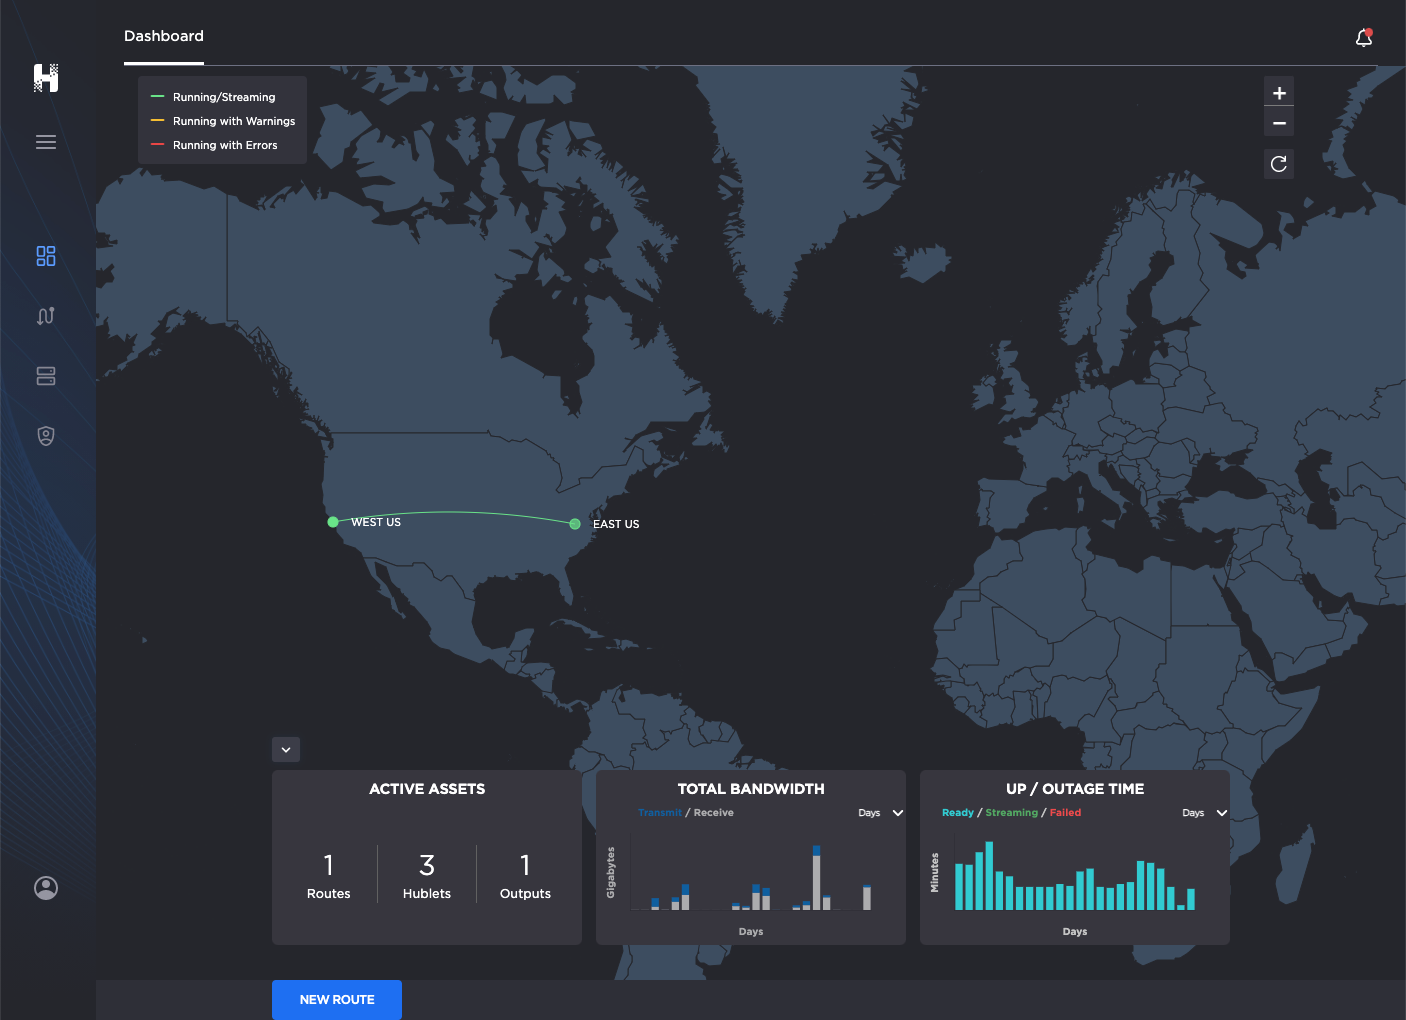
The Control Center is the first screen that appears when you have signed in to the Haivision Hub web interface. The Control Center tab shows you Azure regions with currently active routes, along with dynamically updated information on the number of routes, outputs, and conflicts associated with each region. Analytics on active assets, bandwidth usage and outages/uptime appear at the bottom of the Control Center.
To view the Control Center:
Click the Control Center option in the navigation sidebar to get to the dashboard from anywhere in the interface. Use the More menu at the top of the sidebar to expand/collapse the sidebar.
The Control Center view includes dots on the global map to represent the active regions, and lines showing routes between regions. The color of these dots and lines indicates various states: