System Activity and Details
The web interface includes dashboards to provide a quick view of the overall system health. The System Activity dashboard shows the current status snapshot of your system as a whole, including disk space and Media Platform bandwidth.
To view the system's activity dashboard:
In the side menu under Administration, click Reporting.
Click System Activity in the navigation toolbar. The System Activity dashboard appears:
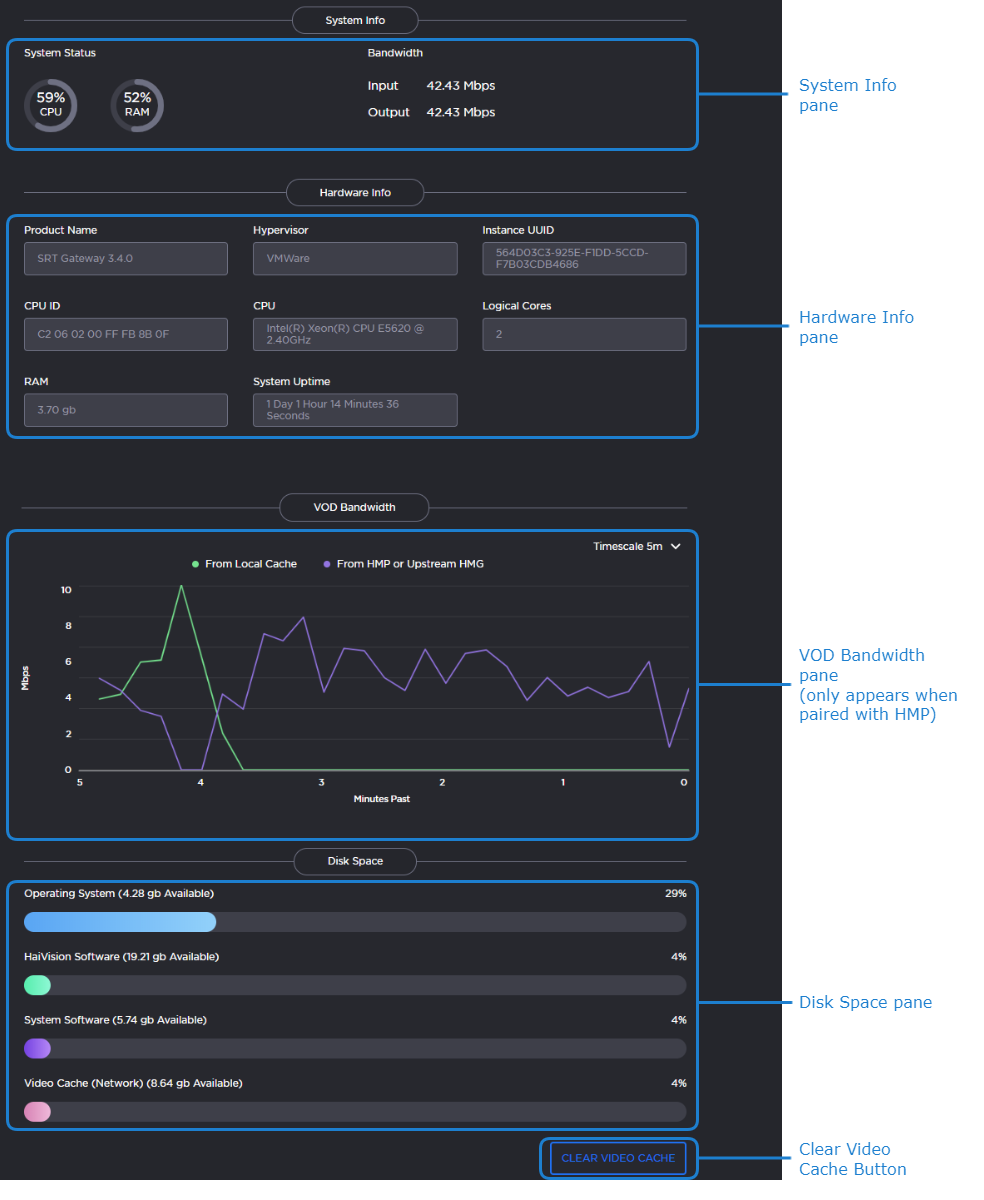
The System Info pane provides the following information:
CPU usage
Memory usage
Input/Output network bandwidth
The Hardware Info pane provides the following information:
Product edition and version
VMware information (if applicable)
CPU, number of logical cores, and RAM information
Service tag and express service code (if using an Media Gateway/SRT Gateway server)
System uptime
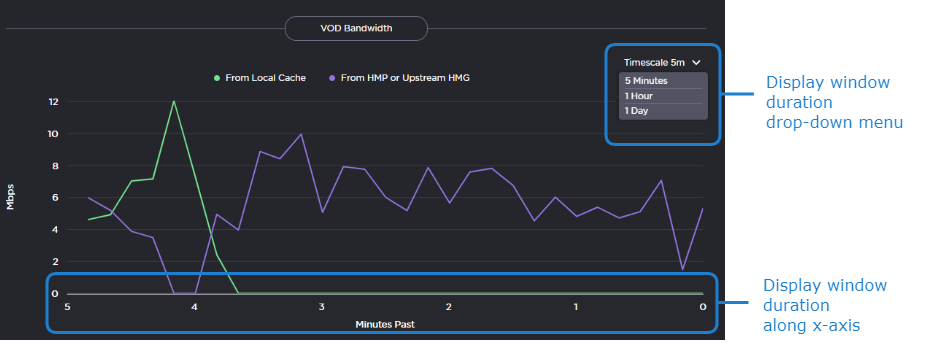
When paired with a Haivision Media Platform, the VOD Bandwidth pane appears and charts usage in Mbps.
Clicking the items in the legend allow you to tailor the display to include information from Media Platform, the cache, or both.
Use the drop-down menu at the top of the chart to specify the display window for the graph starting from now (that is, "0"). When the actual timeframe exceeds the specified display window, only the most recent data of the specified length of time is displayed. That is, if 5 Minutes is selected, only the last five minutes of data is displayed. Any data older than five minutes is dropped from the graph.
In the Disk Space pane, you see information regarding disk usage.
Disk Space | Corresponding Directory/Partition Location |
|---|---|
Operating System |
|
Haivision Software |
|
System Storage |
|
Video Cache |
|
Click Clear Video Cache to delete cached video previously downloaded from HMP. When prompted to confirm, click Clear.