Diagnostics
Diagnostics allow an admin user to view the operational status of system services. This searchable feature is accessible through the Global Admin Diagnostics page.
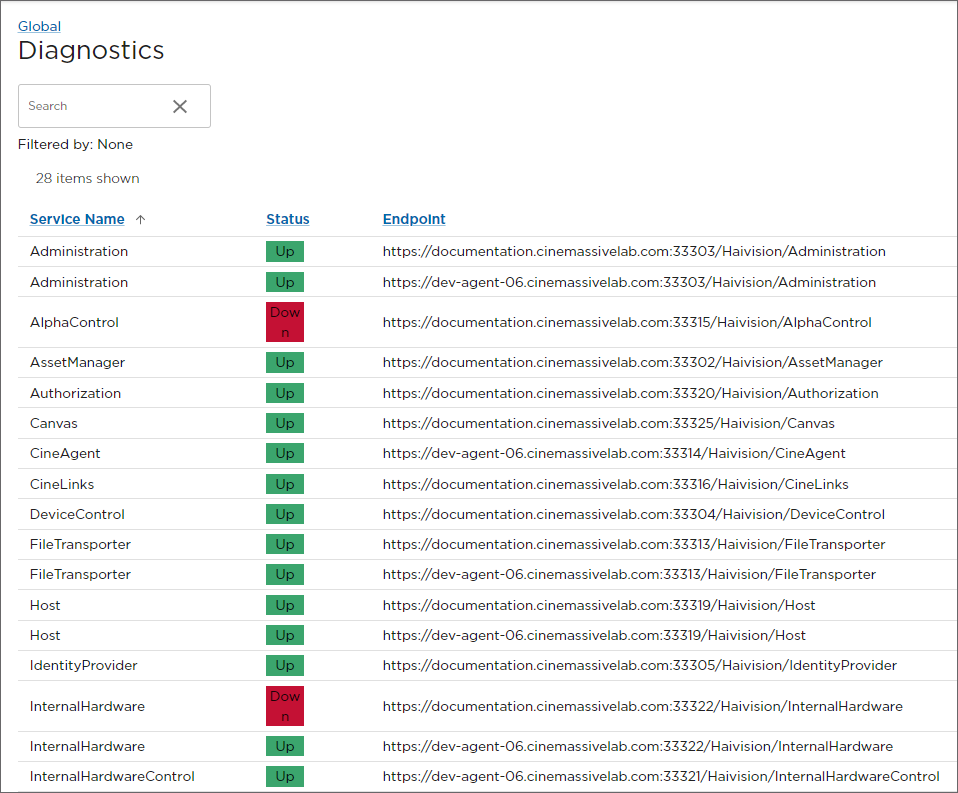
Services are listed by Service Name, Status, and Endpoint. If the status is listed in green as Up the system is online and working as expected. If a service is offline or in error, the status will be highlighted in red and listed as Down.
The Endpoint column provides information which requires no action by the user. IT specialists may find it useful if troubleshooting a performance issue.
Note
An admin or IT support tech may use endpoints to troubleshoot diagnostic issues.
If multiple services are listed as down:
Browse the endpoints (specifically the subdomains).
- If the subdomains in error are the same, a networking issue may be the root cause requiring a system reboot.
- If the endpoints are isolated or mixed among the subdomains, the service may be restored by restarting the subject machine in the Command 360 interface.
Hover over any column heading to sort the table alphabetically. An arrow appears to the right of the heading and can be toggled to ascending or descending order by clicking directly on the arrow. The list re-sorts accordingly.