Viewing Kraken Statistics
From the Streams Statistics page, you can view statistics for the Stream as well as the configured Input, Decoder, Encoder, and Output. In addition, for SRT streams, the Statistics page includes links to SRT Input and Output Statistics graphs.
To view Kraken statistics:
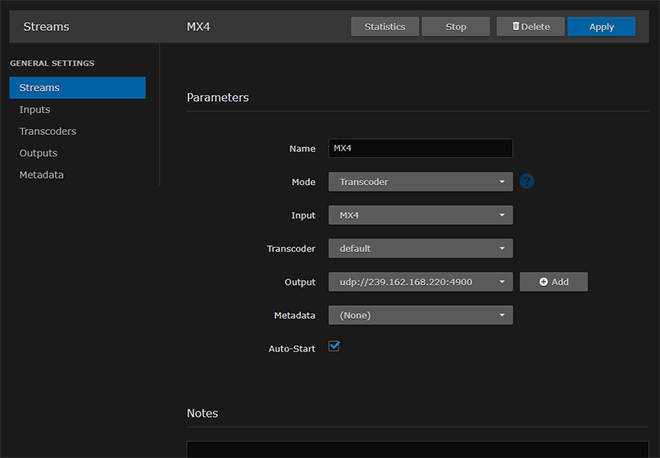
From the Streams List view, click any line in the table to open the Detail View for an active stream.
On the Detail View, click Statistics.
The Statistics page opens in a separate tab.
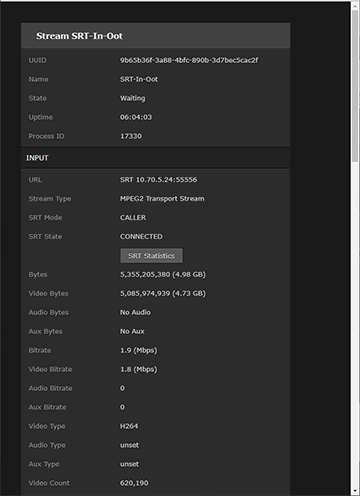
Scroll down to view the statistics.
For SRT streams, to view the SRT Input or Output Statistics graphs, click the SRT Statistics link in either the Input or Output section.
The selected SRT Statistics graph opens in a new tab. See SRT Statistics for detailed descriptions of each statistic.
As shown in the following examples, the graphs track Delays (in ms) and Bandwidth Used (in kbps).
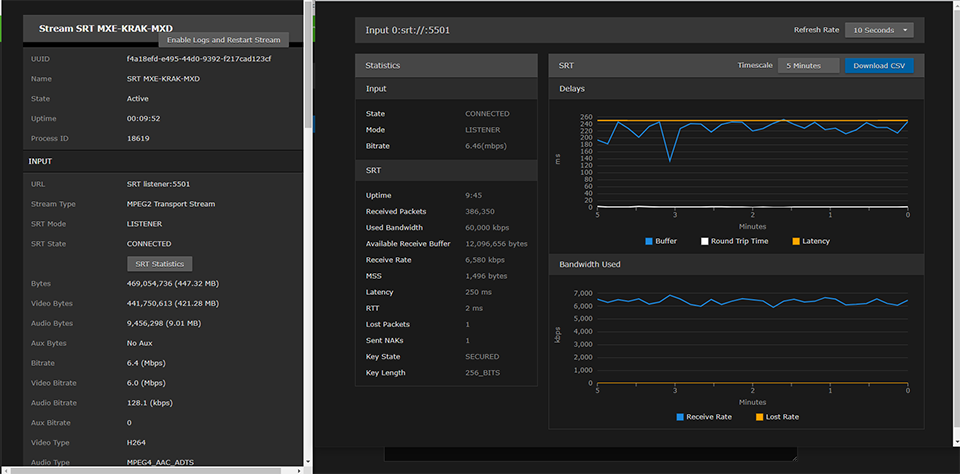
The Delays section provides a graphical overview of how the SRT stream buffers are handling the traffic.
The Bandwidth Used section provides a graphical overview of how the network bandwidth available to the SRT stream is actually being used, in terms of the rate at which packets are sent, received, resent and lost, as well as the data volume (rate × time).
You can adjust the Timescale and Refresh Rate for the graph.
For the Delays, you can show or hide the Buffer, Round-Trip Time or Latency statistics.
For the Input Bandwidth, you can show or hide the Receive Rate and/or Lost Rate.
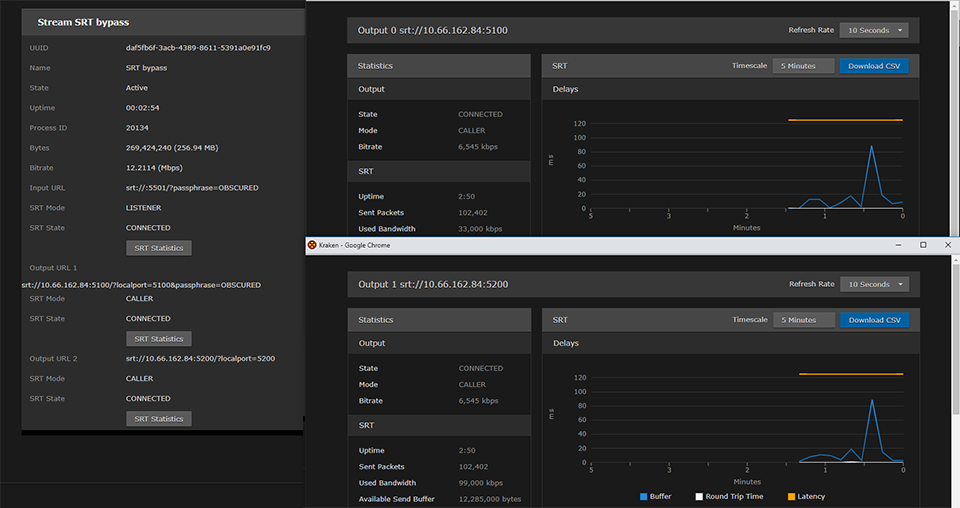
For the Output Bandwidth, you can show or hide the Sending Rate and/or Retransmit Rate.
Note
Kraken also supports multiple SRT graphs on Output.
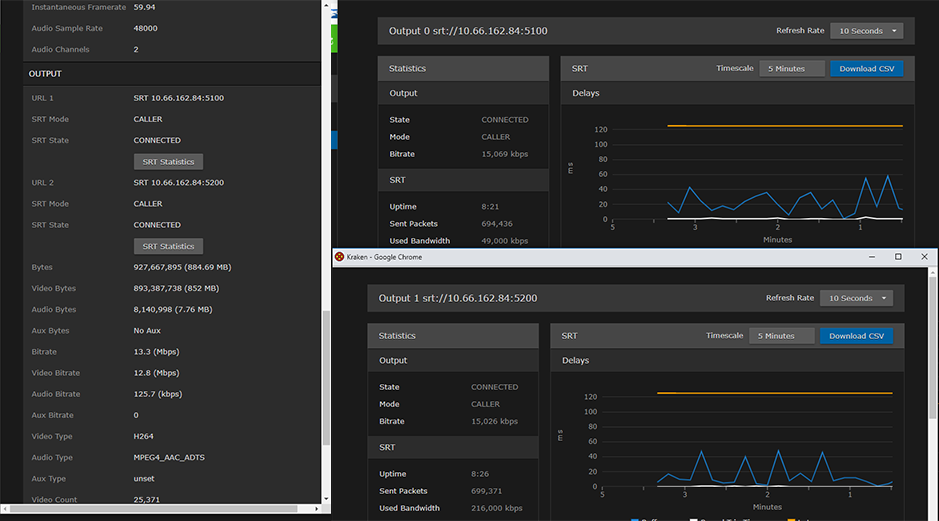
To download the statistics in a CSV file, click Download CSV.
Related Topics: