Viewing Source Status
To view various statistics and telemetry of a source, click the 
The information shown depends on the source appliance:
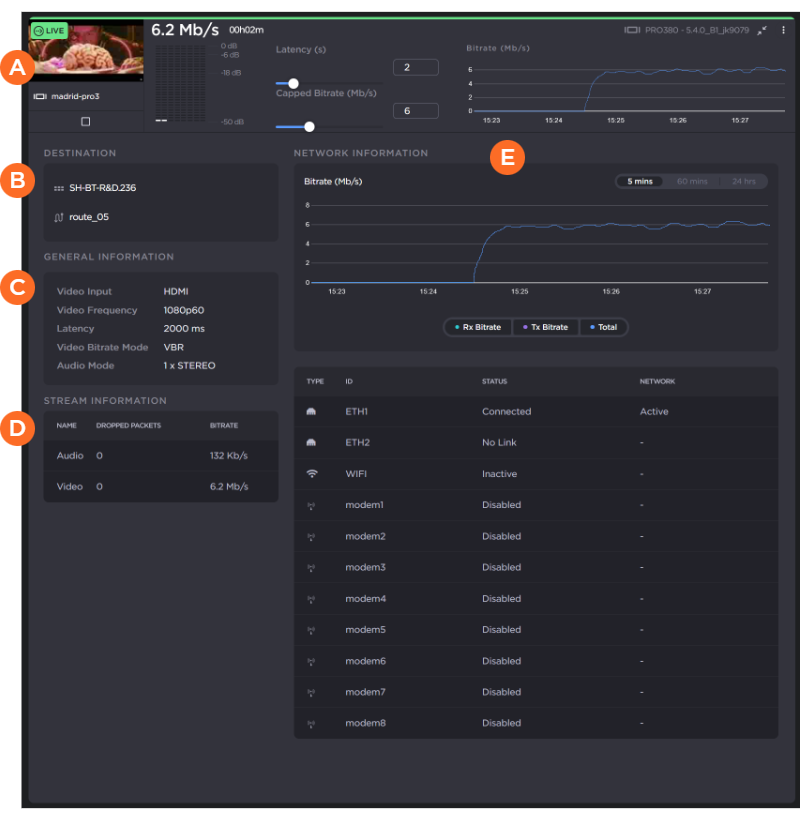
For field units, the following sections appear when expanding the source:
 | The top section shows the same information that appears when viewing the source detail view by clicking the |
 | Destination section includes the receiver and route name.
|
 | General Information section includes source audio and video information. |
 |
|
 | The Network Information section includes:
|

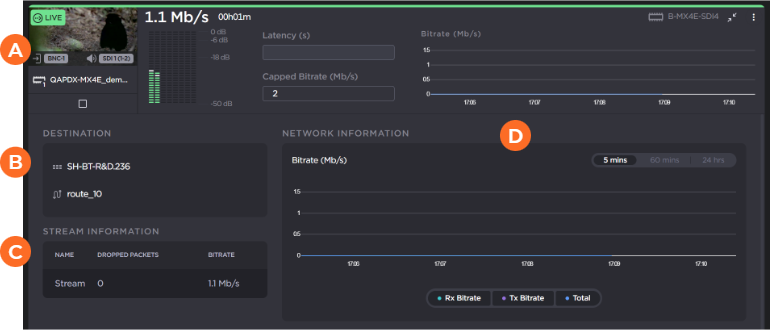
For Makito devices, the following sections appear when expanding the source:
| The top section shows the same information that appears when viewing the source detail view by clicking the  |
| Destination section includes the receiver and route name.
|
| Stream Information section shows the number of dropped packets and the current stream bitrate. |
| The Network Information section includes a bitrate Graph displaying the bitrate for the last 5 minutes, 60 minutes, or 24 hours as selected in the top right of the graph. You can optionally display the source's receive, transmit, or total bitrates on the graph by toggling their display in the legend at the bottom of the graph. |