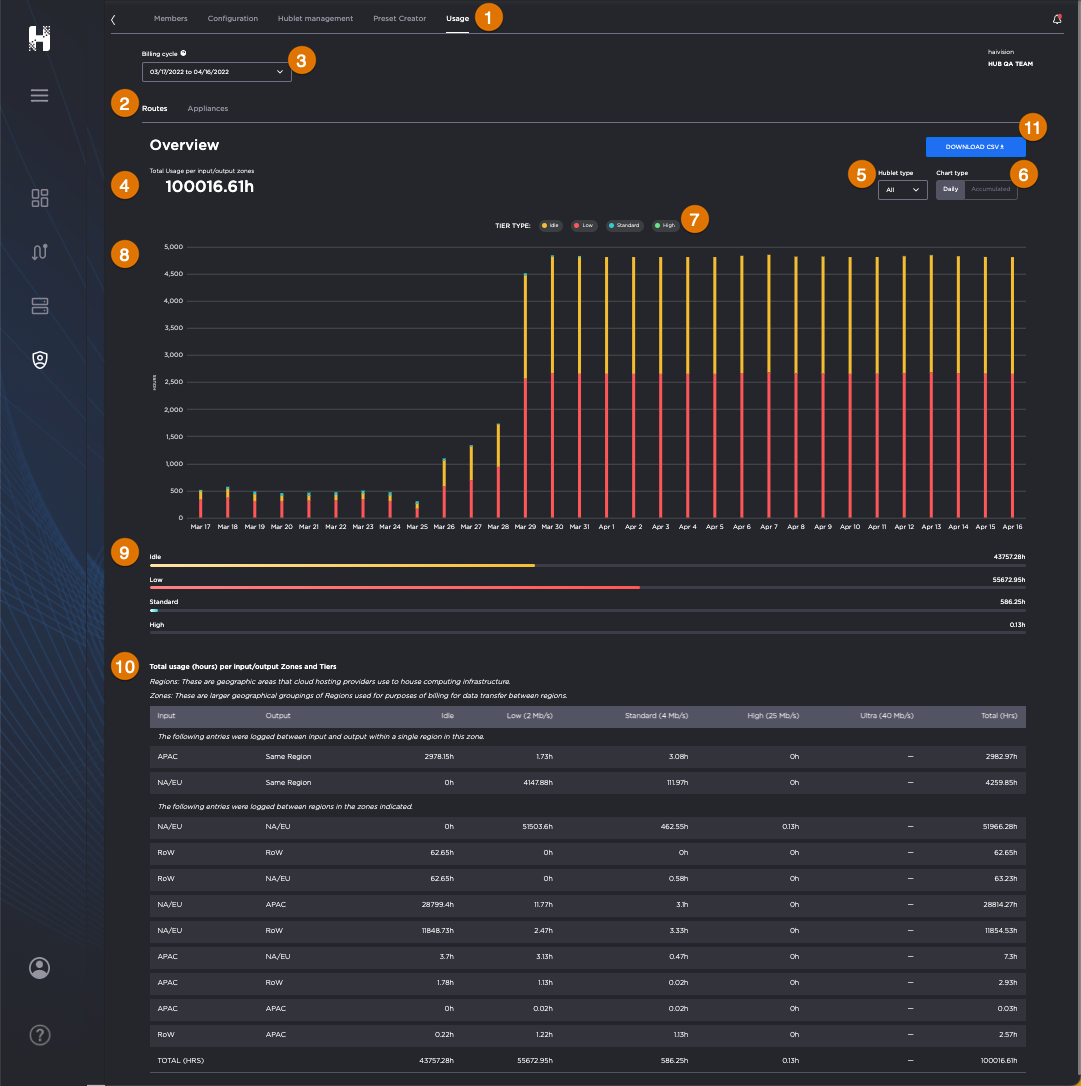
Usage Tab

Routes Usage

Routes Usage

Routes Usage screen, labeled.

Usage Tab

Routes Sub-Tab

Billing Cycle Picker (Date Range)

Total Usage (in hours)

Hublet Type Picker

Chart Type Filter

Bandwidth Tier Filter

Graphical Summary Chart (Stacked Bars depict Bandwidth Tier Hours by Date)

Detailed Breakdown

Tabular Breakdown of the Usage Data by Input/Output Zones and Tiers

Download CSV Button 


Routes Usage screen with cursor hovering over a chart, revealing a statistics panel.

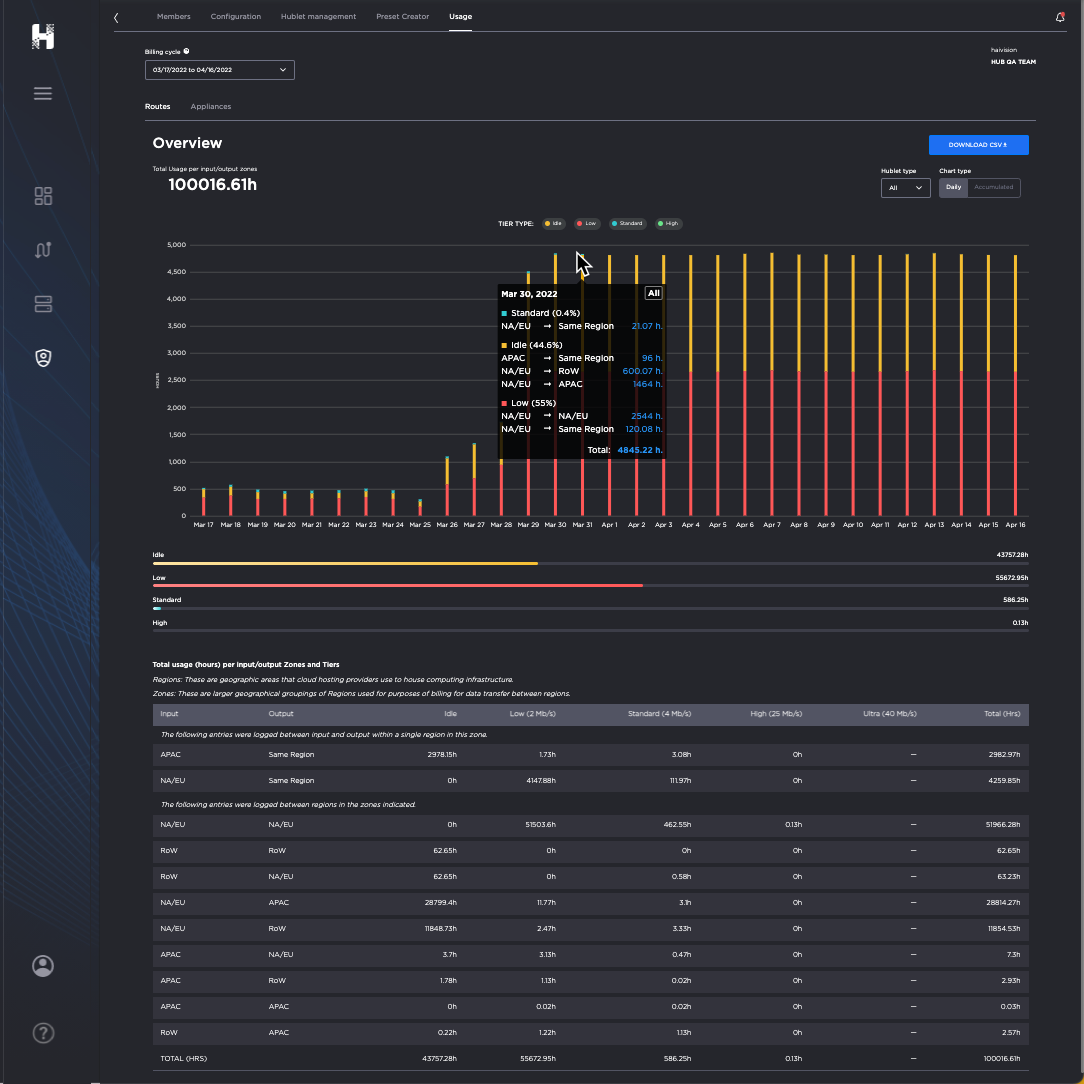
Hovering your cursor over a bar in the chart reveals the color-coded breakdown of the tiers and hours for that day.
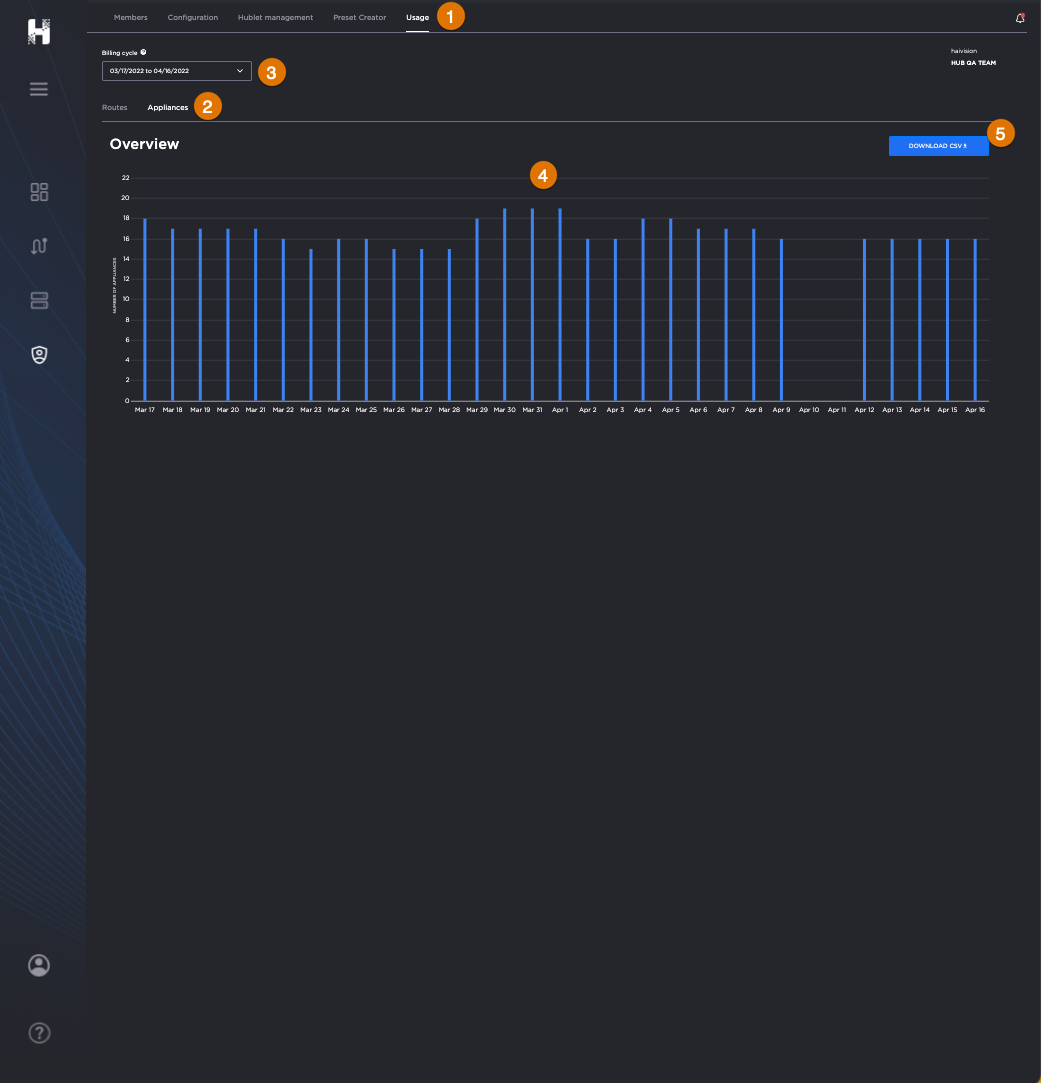
Appliances Usage

Appliances Usage

Appliances Usage screen, labeled.

Usage Tab

Appliances Sub-Tab

Billing Cycle Picker (Date Range)

Total Usage Chart (by Number of Appliances)

Download CSV Button


Appliances Usage screen with cursor hovering over a chart, revealing a statistics panel.

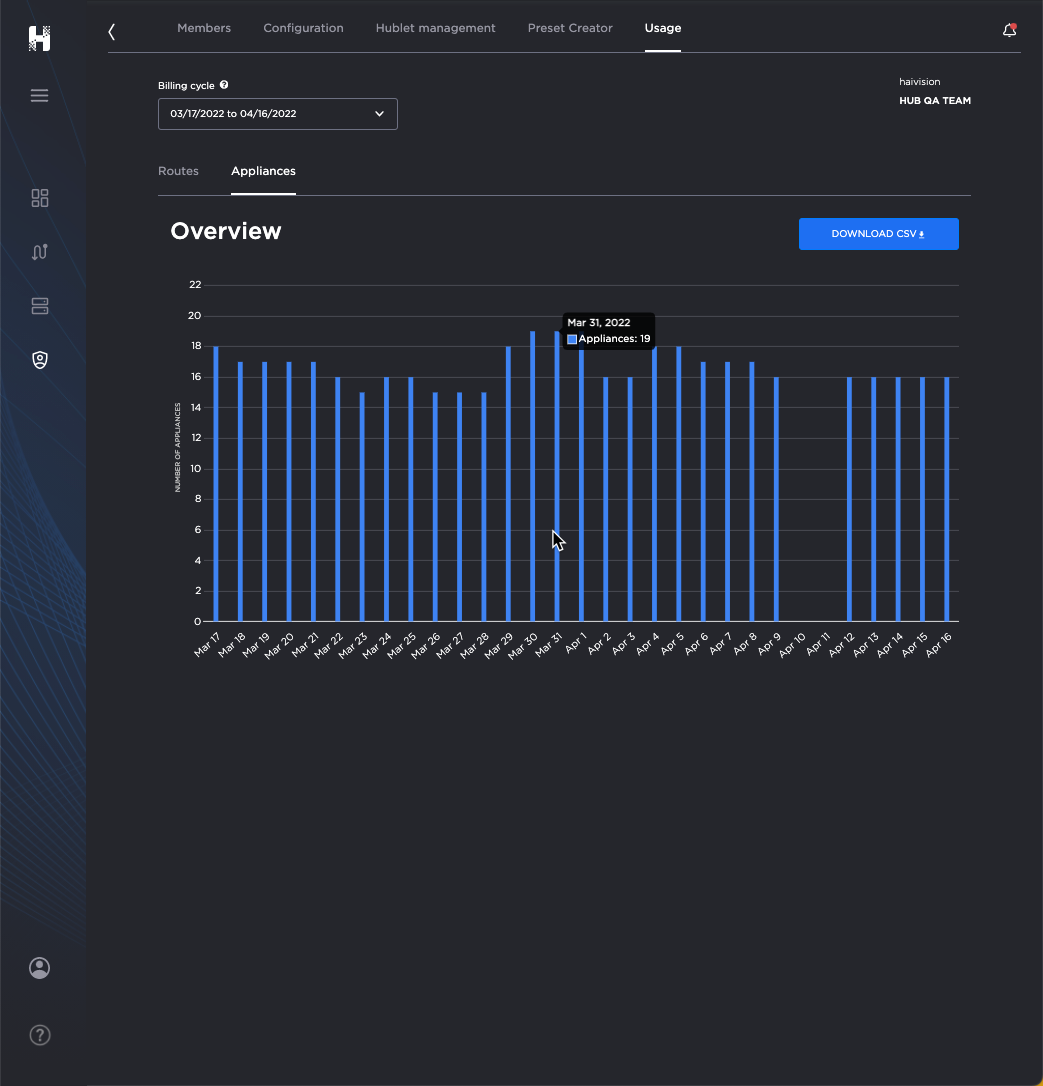
Hovering your cursor over a bar in the chart reveals the number of appliances paired for that day.


JavaScript errors detected

Please note, these errors can depend on your browser setup.

If this problem persists, please contact our support.