_Donut graphs
The donut charts on the Control Center Decoder panels show the resources used per decoder, as well as globally.
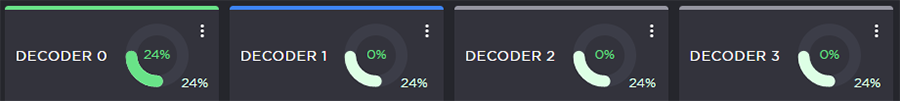
The actual percent usage for the decoder is displayed as text within the ring, while the slice length gives a quick glance view of the percentage. The slice color also changes as follows:
| Darker green | Indicates the percentage of resources used for that decoder. |
| Lighter green | Indicates overall percentage of resources used. It is the same value on all active decoders. |


The color bar at the top of each Decoder panel indicates the status of the streams assigned to it (if any):
| Color | Indication | Description |
|---|---|---|
| Blue | Listening | The decoder has started and is currently waiting for an input stream to be received / connected. |
| Green | Active | The decoder has started and is actively decoding a stream. |
| Gray | Inactive | The decoder is stopped. |
| Red | Error | The decoder has started but is unable to decode the incoming stream due to some errors. Please see the decoder statistics for more details on the error. |