Monitoring the Network Performance / Data transmission
The quality of the output videos depends on the quality of the transmission. Your StreamHub allows you to monitor the performance of each transmission link, control the latency, and other transmission settings.
To display detailed information about a transmission in progress, click on ![]() .
.
![]() – The
– The ![]() (or
(or ![]() ) switch toggles between displaying/hiding detailed network metrics.
) switch toggles between displaying/hiding detailed network metrics.
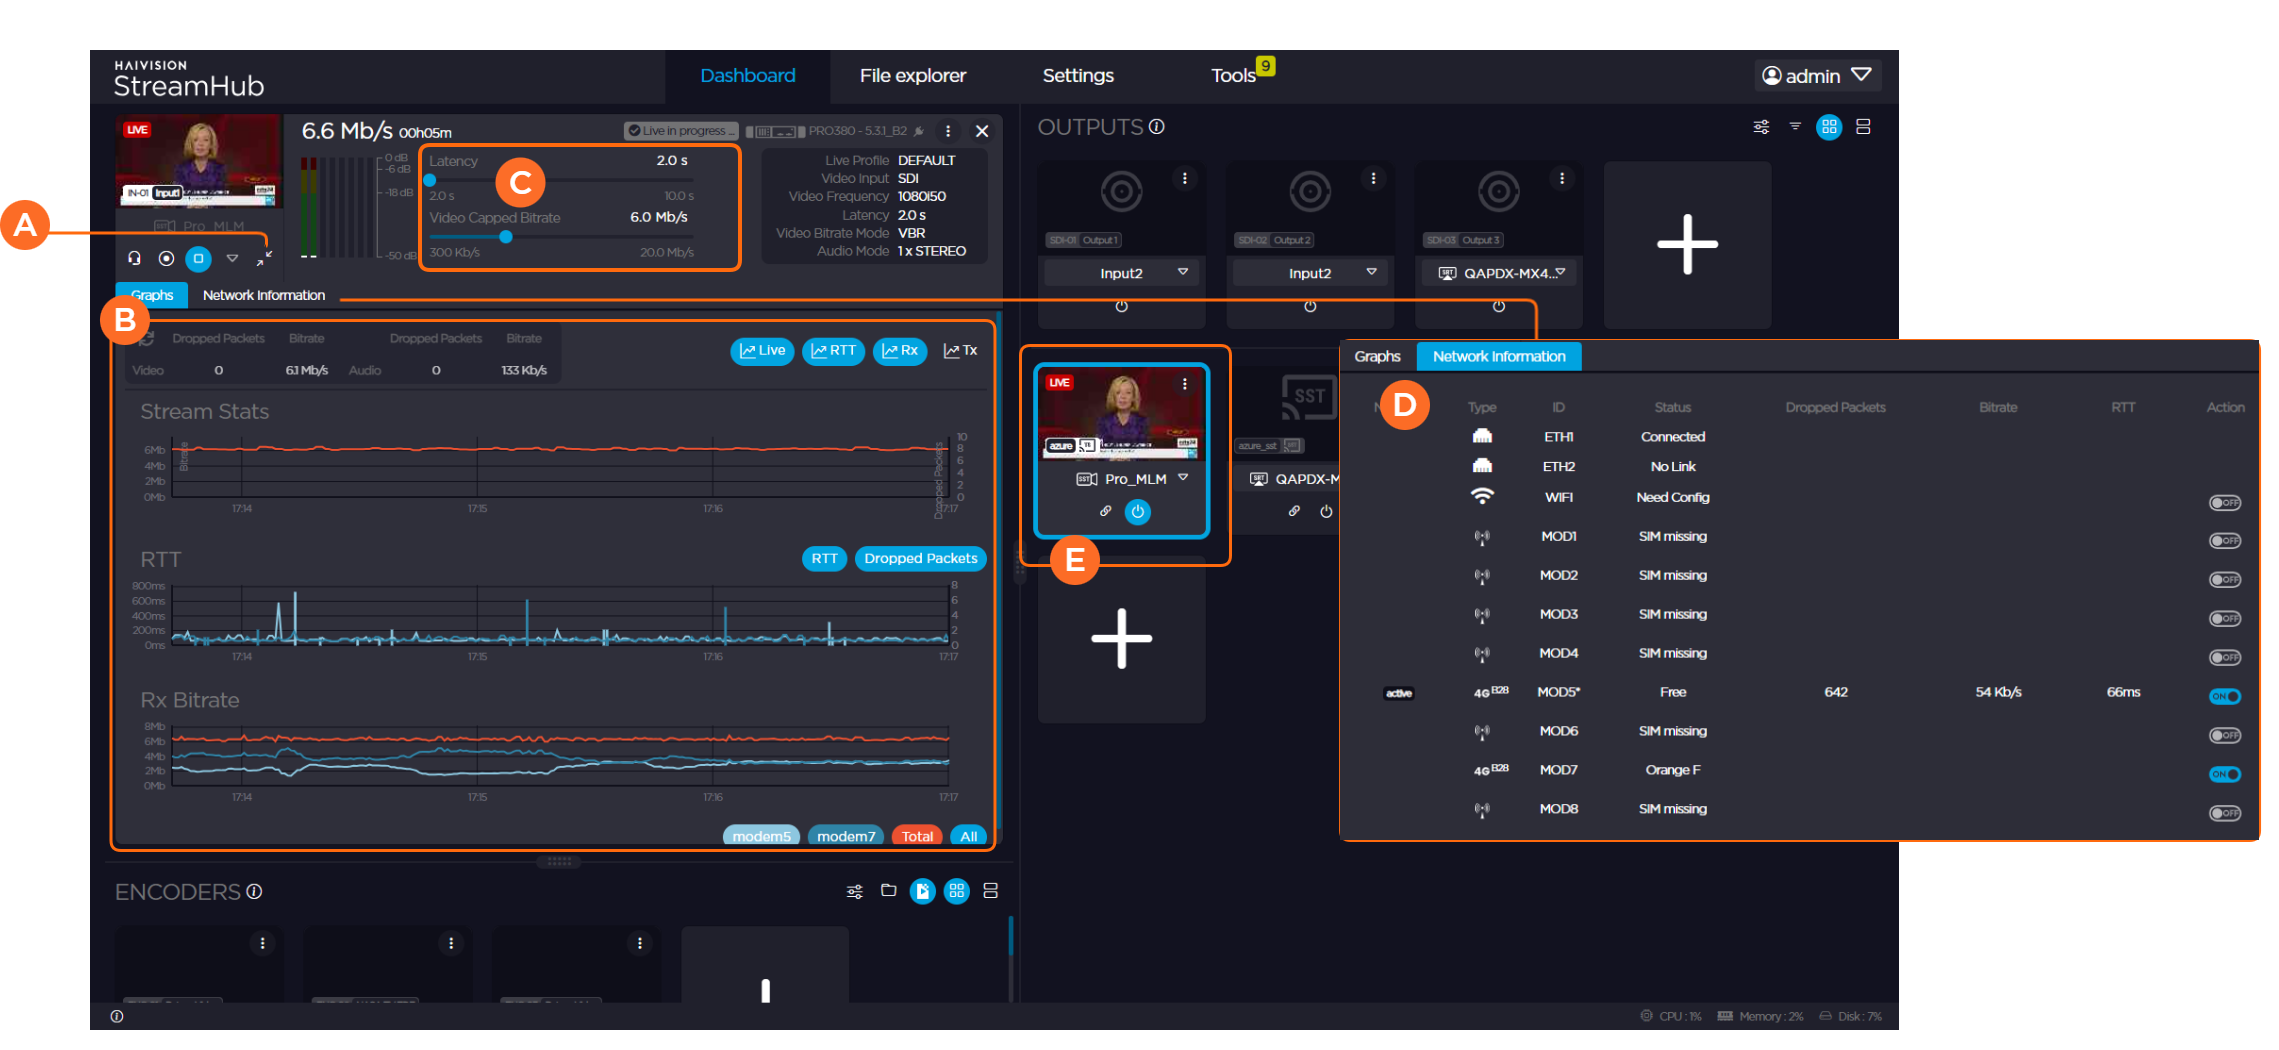
![]() – Under the Graph tab, a real-time overview of the transmission giving:
– Under the Graph tab, a real-time overview of the transmission giving:
A table giving information about video and audio bitrates, and amounts of dropped packets.
A graph line for the Stream Bitrate.
Blue bars to indicate dropped packets.
For each network connection, the amount of dropped packets, the bitrate (kbps) and the RTT (Round Trip Time in ms).
![]() – Control sliders to adjust latency and capped video bitrate. Line graph showing total network bitrate and network bitrate on each active network interface.
– Control sliders to adjust latency and capped video bitrate. Line graph showing total network bitrate and network bitrate on each active network interface.
![]() – Under the Network Information panel, network information about each modem.
– Under the Network Information panel, network information about each modem.
![]() – Highlighted thumbnails indicate the outputs connected to the input.
– Highlighted thumbnails indicate the outputs connected to the input.
Note
Detailed network metrics are provided when performing a Live transmission from a field unit. When receiving other IP input streams (RTMP, RTSP, HLS, etc.), only a stream graph is available.
The "*" sign beside a modem indicates that the modem of a field unit is configured specifically to limit connection capabilities to some frequency bands and/or the 3G/4G mode was activated.
For SRT inputs, Control sliders
 and Network Information
  are not available.

