Billing
The Billing page provides you with details of the costs associated with your LightFlow activities for a given month.
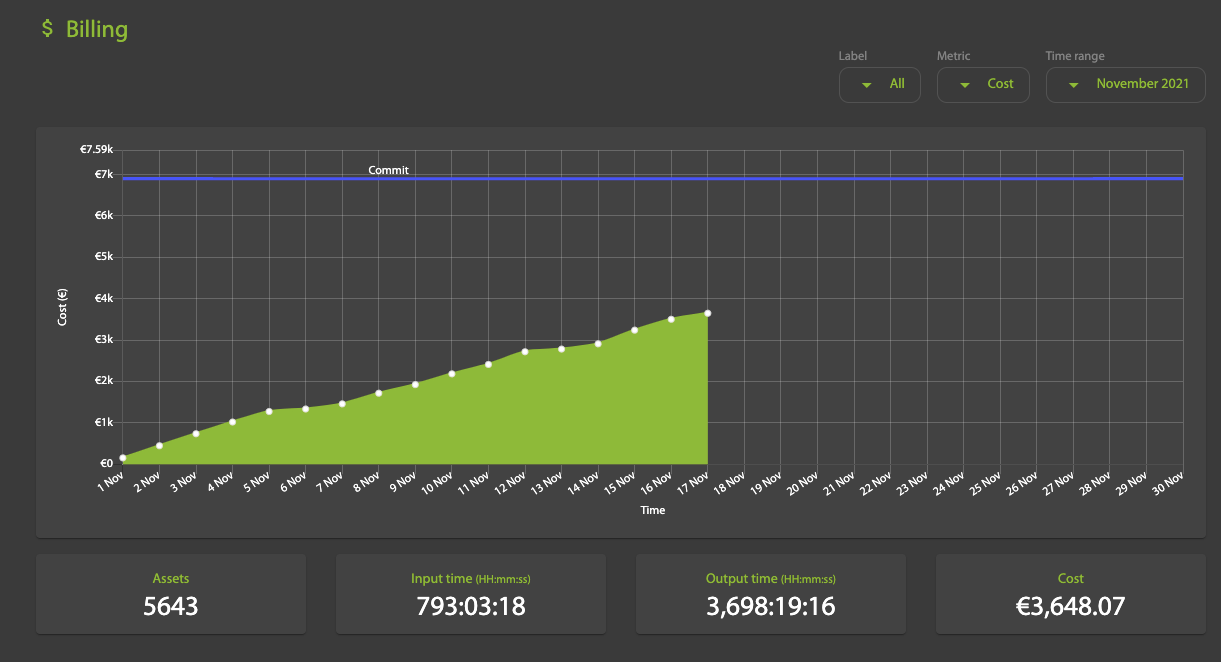
You can set filters to alter what the graph displays:
- Label: Display video assets processed by LightFlow based on custom labels
- Metric: Display daily Cost, Input (minutes), or Output (minutes)
- Time range: Display data for any of the last 11 months
The blue line in the graph shows the Commit negotiated with the CDN (in GB).
Below the graph, monthly summaries of the following are displayed:
- Assets: The total number video assets published by LightFlow.
- Input time: The total time LightFlow spent on video input (hh:mm:ss).
- Output time: The total time LightFlow spent on video ouput (hh:mm:ss).
- Cost: The total cost incurred for using LightFlow