
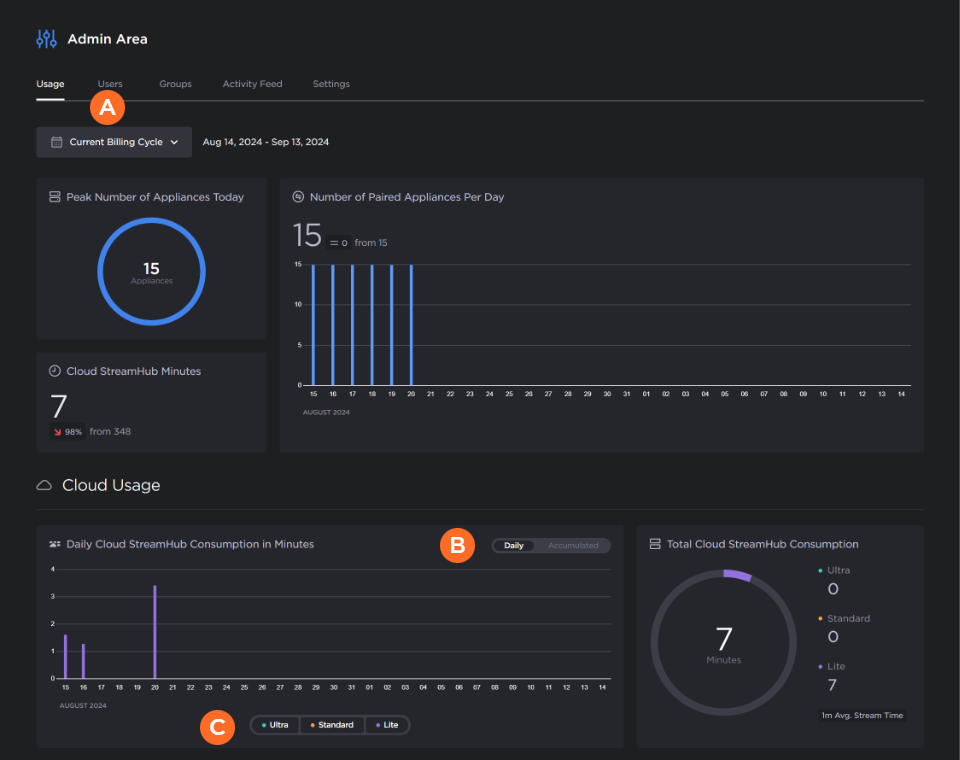
Monitoring Your Organization's Usage

The Usage tab shows various statistics allowing you to monitor your organization's overall usage within Hub 360. See the sections below for instructions on using the highlighted elements in the following figure.

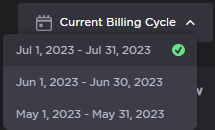
Viewing a Different Billing Cycle

If desired, click

A
Calendar icon
 Current Billing Cycle and select a previous month to view the statistics of that month. The
Checkmark
 icon indicates the currently selected value.

Using the Daily Cloud StreamHub Consumption in Minutes Chart

In the Daily Cloud StreamHub Consumption in Minutes chart, you may click

B
Daily or Accumulated to change how the data in the chart is displayed.

Daily

Daily Consumption

Accumulated

Accumulated Consumption

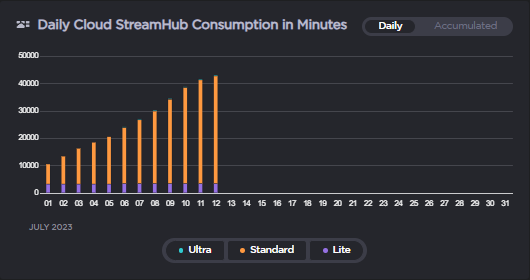
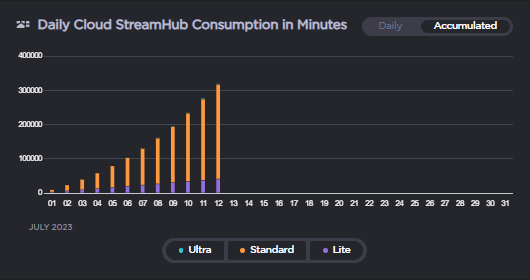
Also, you can filter the available Cloud StreamHub performance types by clicking on the

C
Ultra, Standard, and Lite items in the legend at the bottom of the chart. For example, as shown in the following figures, by removing the Standard and Lite data you can see the Ultra data since its usage was much lower than the others and the y-axis limit automatically adjusts when the filtering is applied.

All Data Showing

All Data Consumption

Only Ultra Showing

Only Ultra Consumption

JavaScript errors detected

Please note, these errors can depend on your browser setup.

If this problem persists, please contact our support.