Viewing System Activity
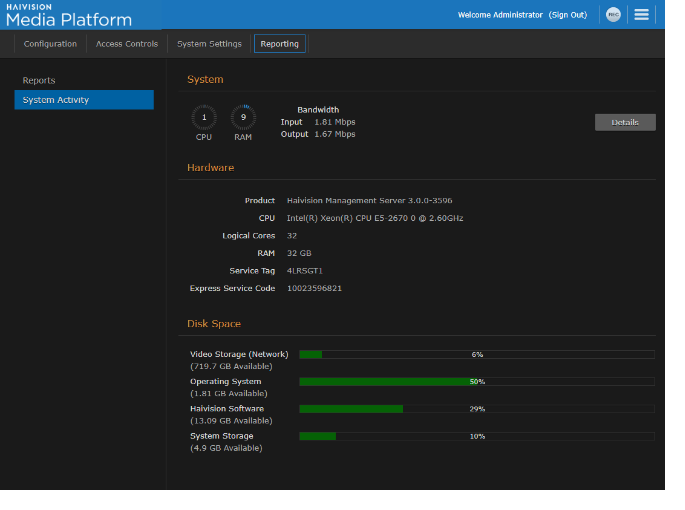
The System Activity pane summarizes:
Real-time system status information, such as CPU and memory usage, and I/O bandwidth bitrates, with the option to view graphical details.
Hardware details, including whether HMP is running on a VM or a Haivision appliance.
The available space for (local) video storage, operating system, Haivision software, and system storage (in GBs available, as well as percent used).
Note
Haivision recommends that you expand the VM disk when the video storage reaches 90% or more of the available space.
To view the System Activity:
Click the
 icon and select Administration from the navigation drop-down menu.
Click Reporting on the toolbar and then click System Activity on the sidebar.
Tip
The color of the bars in the Disk Space graph change to orange when the space used on disk reaches 75%, and then to red when it reaches 90%.
To view graphs of the network bandwidth, CPU, and memory click Details.
The X-axis units are days, hours, or minutes past (corresponding to the selected Time Scale). The Y-axis units are as follows:Network bandwidth usage (in Megabits per second)
CPU load usage (in percent)
Memory usage (in percent)
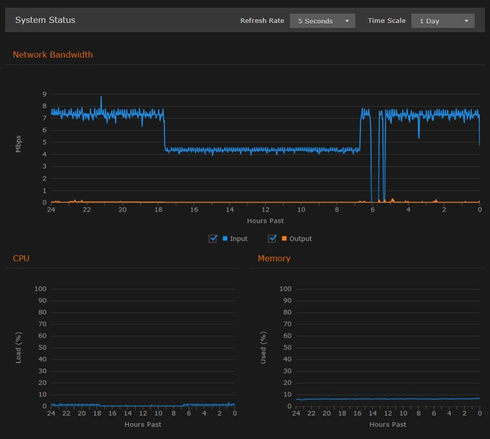
Bandwidth, CPU and Memory Statistics
You can adjust the refresh rate (from 1 second to 30 minutes) and the time scale (from 5 minutes to 30 days past) for the graphs.
To fine-tune the bandwidth usage graph, select the data to include: input and/or output (playback).
To display an exact reading for the time and usage, you can mouse-over any of the graph lines, as shown in the following example:
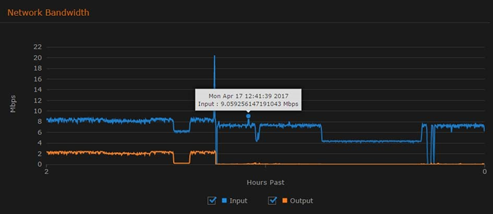
Network Bandwidth Graph Example
Related Topics