Viewing the Detailed Info Dashboard
To view graphs of the network bandwidth and CPU and memory usage:
In the side menu, click Reporting.
Click Detailed Info in the navigation toolbar. The Detailed Info dashboard appears:
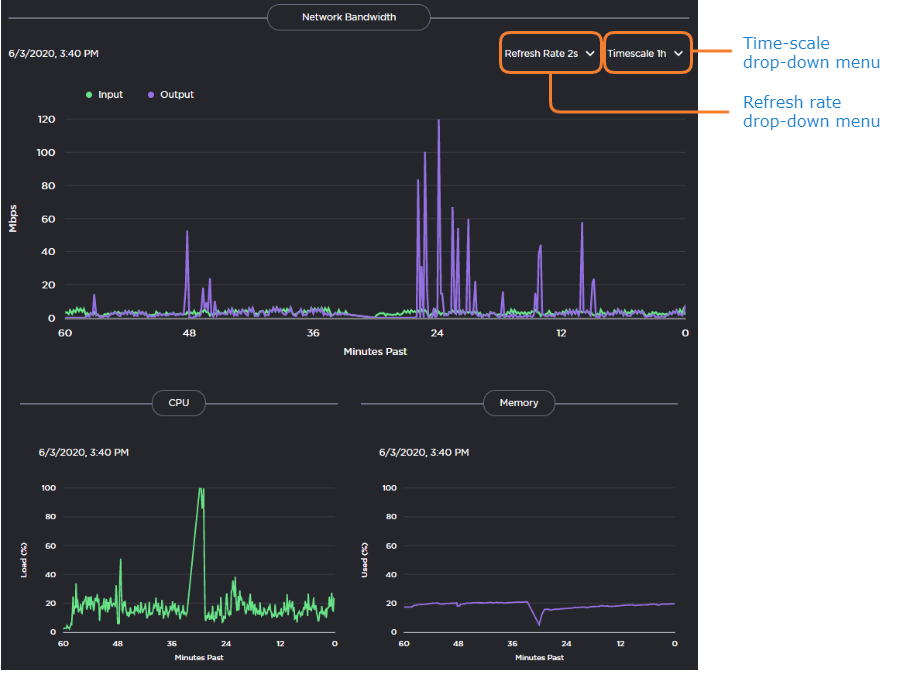
Use the drop-down menus at the top of the window to specify the refresh rate and time scale for the graphs.
The refresh rate indicates how often the graph is updated and the time scale indicates the amount of time displayed on the graph. When the actual timeframe exceeds the specified time scale, only the most recent data of the specified length is displayed. That is, if 5 Minutes is selected, only the last five minutes of data is displayed. Any data older than five minutes is dropped from the graph.