Viewing System Activity
The web interface includes dashboards to provide a quick view of the overall system health. The System Activity dashboard shows the current status snapshot of your system as a whole, including information about the system, hardware, and disk space.
To view the system's activity dashboard:
In the side menu, click Reporting.
Click System Activity in the navigation toolbar. The System Activity dashboard appears:
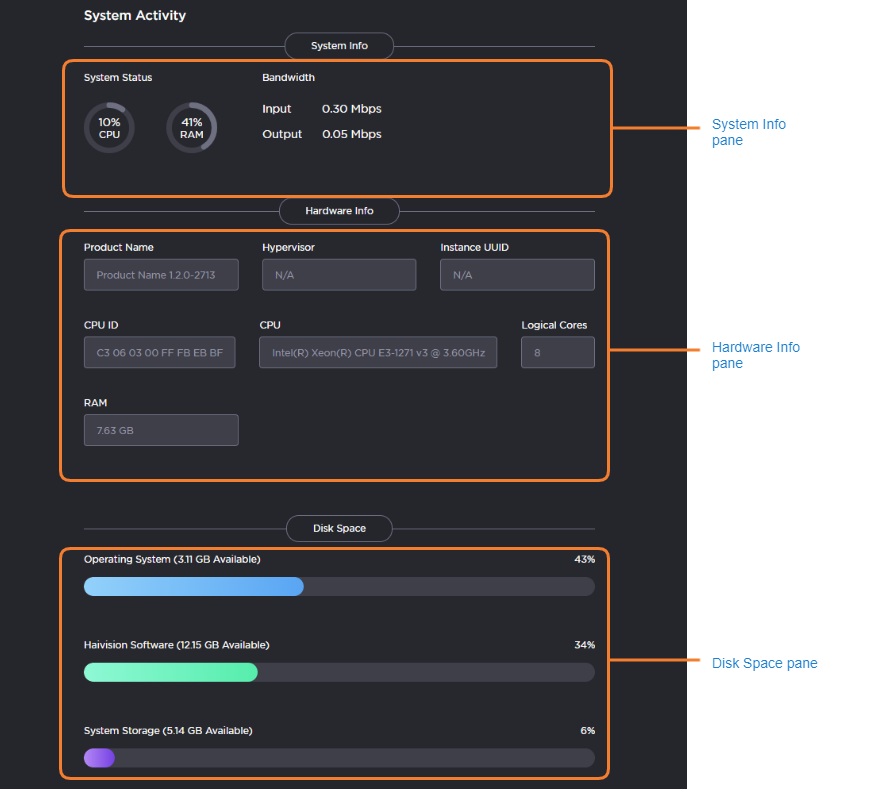
The System Info pane provides the following information:
CPU usage
Memory usage
Input/Output network bandwidth
The Hardware Info pane provides the following information:
Product edition and version
VMware information (if applicable)
CPU, number of logical cores, and RAM information
Service tag
The Disk Space pane provides the following information:
Operating System
Haivision Software
System Storage