Monitoring Ancillary Data

If Ancillary Data is enabled, the

icon appears on the top bar of the Web Interface and the Unit Panel.

Unit Panel

  1. From the Home menu, tap
    .
  2. Tap

    to display Ancillary Data.

    Note

    In multi-encoding mode, tap the screen to display other sources.

Web Interface

From the Home menu, click Monitoring > Ancillary Data.
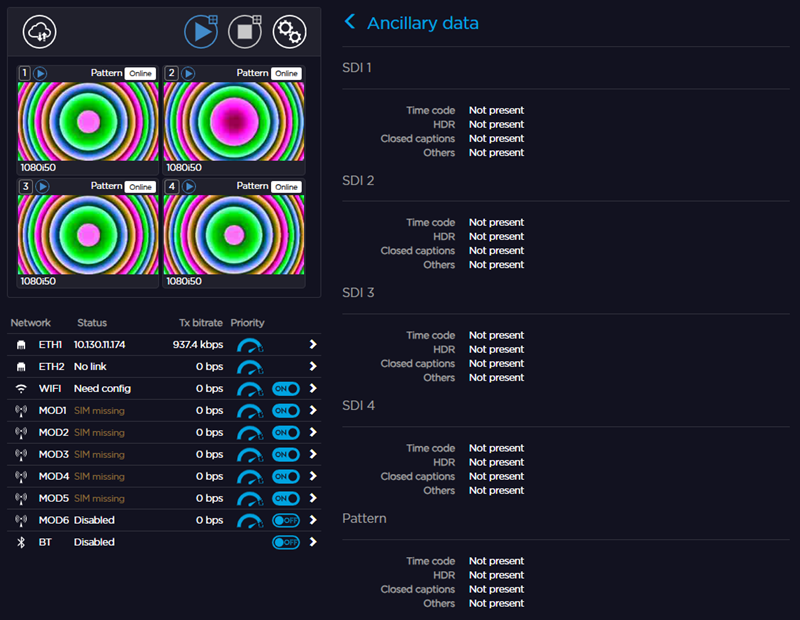
Ancillary Data on Pro4
JavaScript errors detected

Please note, these errors can depend on your browser setup.

If this problem persists, please contact our support.