
Viewing Route Details

From the Routes screen, you have several methods to drill down into information regarding your route and its health.

Choose from the following to learn what information is available:
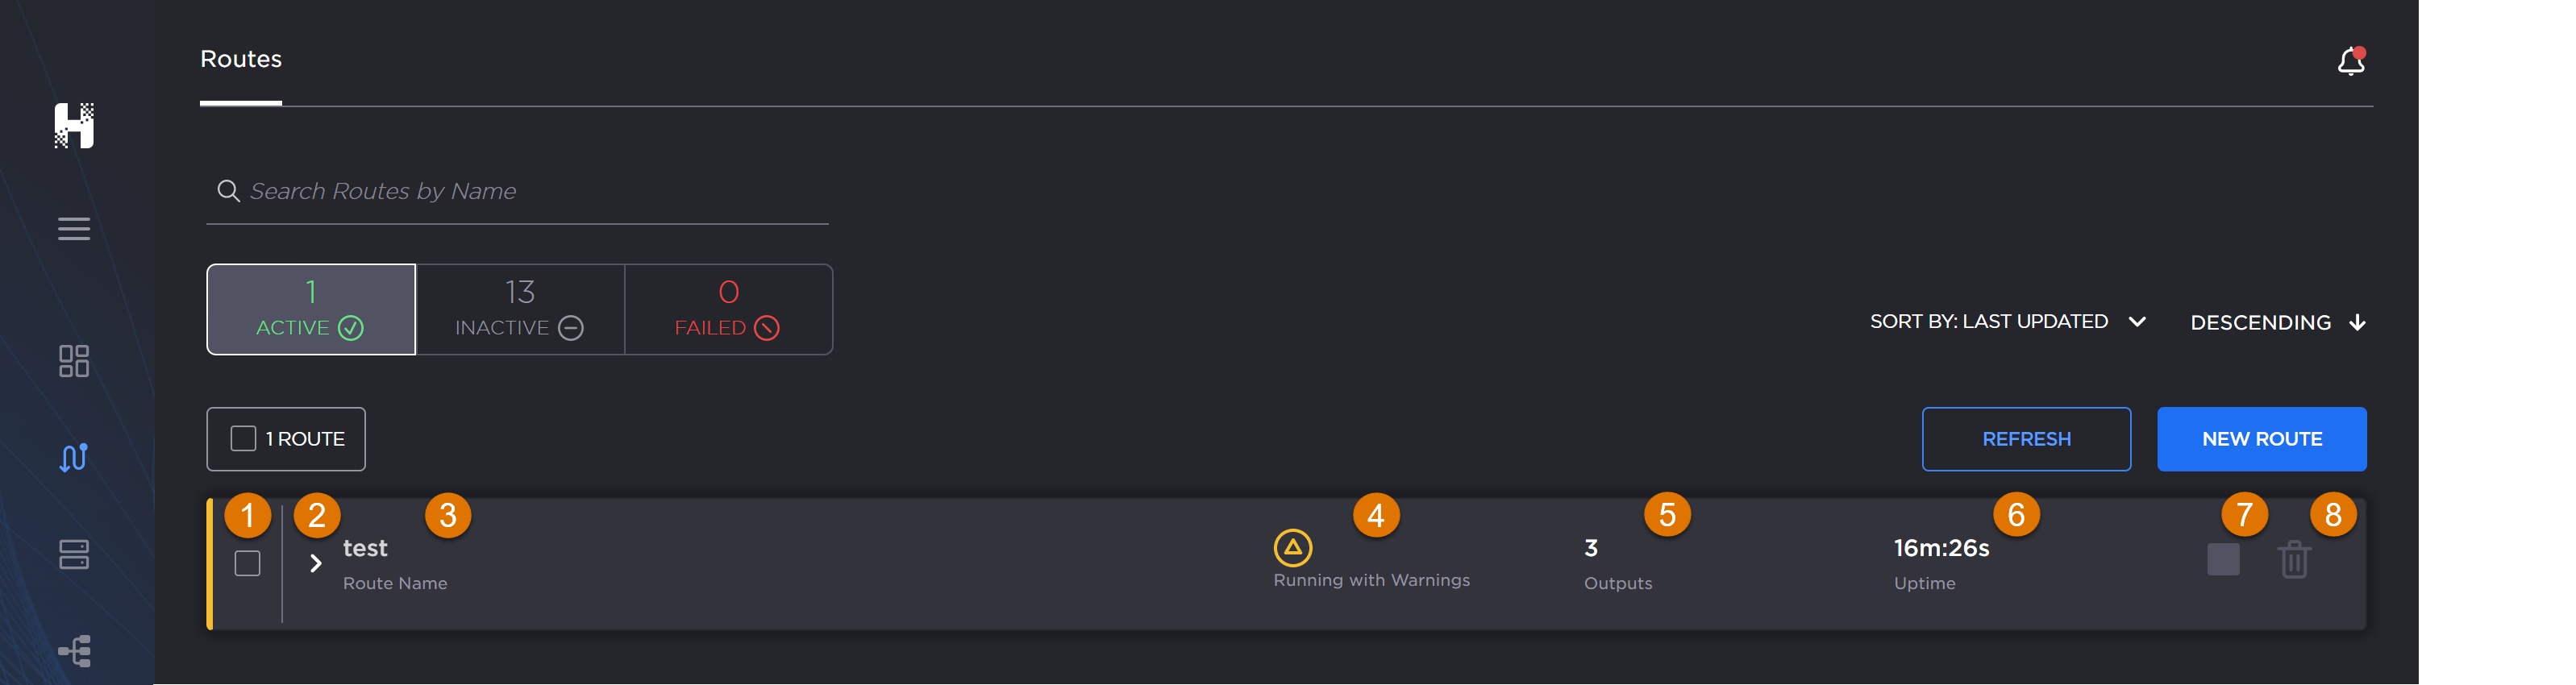
Listing

From the Listing

At a glance, each route's listing provides useful information and actions, such as:

  •  Selection Checkbox
  • QuickView Toggle
  • Route Name
  • Route Health Icon
  • Output Hublet Count
  • Route UpTime
  • Start/Stop Buttons
  • Delete Button

Individual route item, labeled.

Listing QuickView

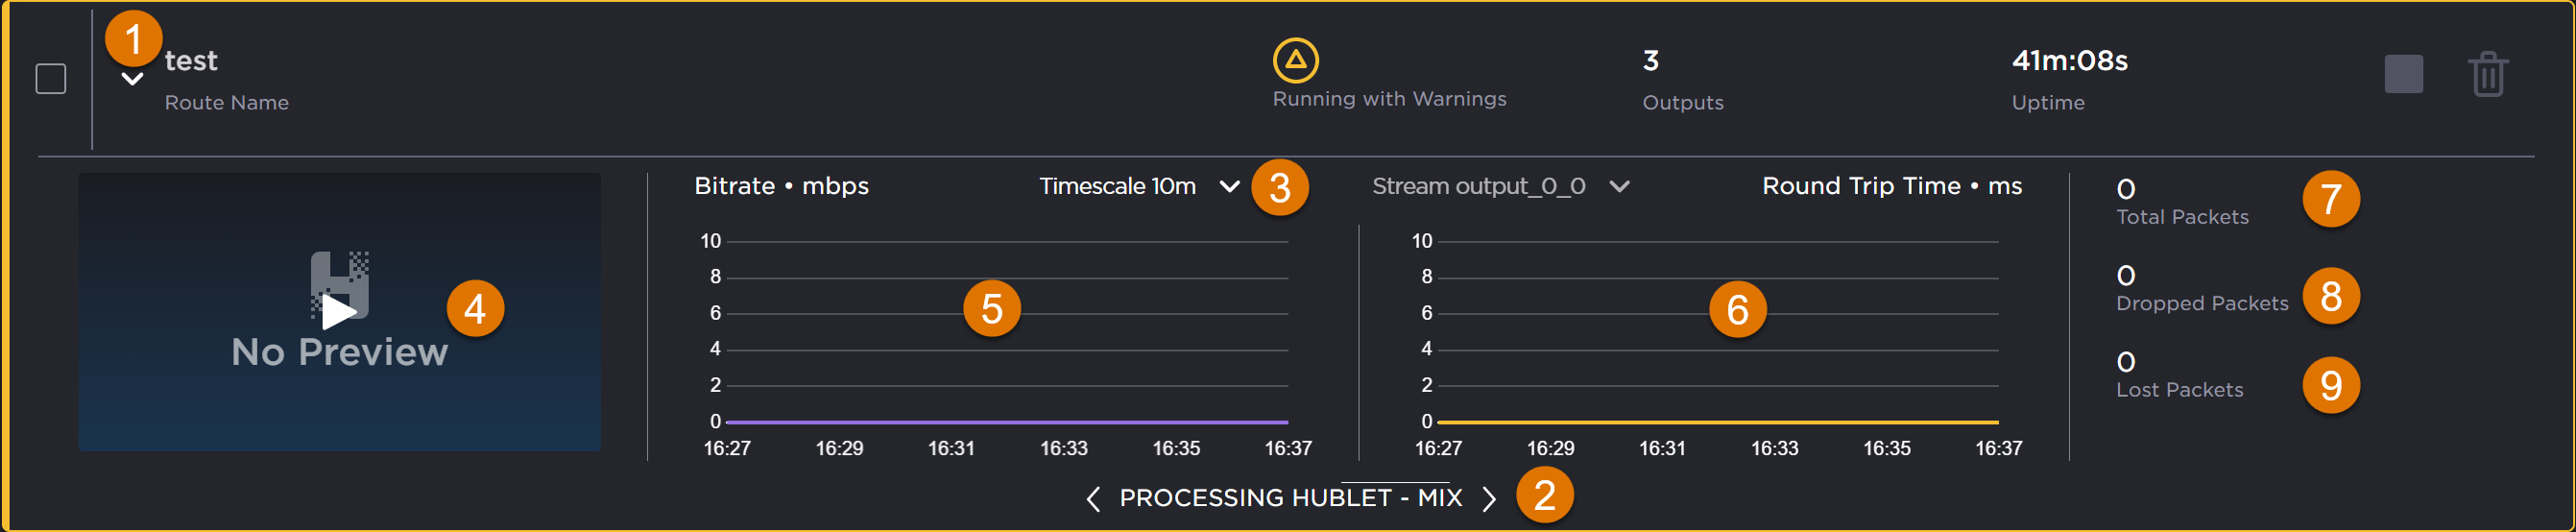
From the Listing QuickView

The listing's QuickView panel allows you to cycle through each of the route's Hublets specifics. 


To get a quick view of stats and a preview of what's streaming for each Hublet:

  1. Click the Route
    toggle
    next to the listing's checkbox to show/hide the QuickView for the route.
  2. When the QuickView opens, click the Hublet
    selector
    to cycle through the stats for each of the route's Hublets.
  3. If desired, change the Timescale
    menu
    for the charts with the dropdown menu.

    Route item's QuickView panel, labeled.
    • Route QuickView toggle
    • Current Hublet selector
    • Chart Timescale: 5m, 10m, 30m
    • Preview pane
    • Bitrate chart
    • Round Trip Time (RTT) chart
    • Total Packets count
    • Dropped Packets count
    • Lost Packets count
Routes Builder

From the Routes Builder

To view the details on a route:

  1. Click
    Routes on the navigation sidebar. If selection is not visible, click the
    More menu to expand.
  2. On the Routes screen, locate the route in which you are interested. 

    Tip

    If there are a number of routes, use the Filtering and Sorting options above the list pane to speed locating the desired route.

  3. Click the route's name in the listing to switch to the

    Route Builder view.

    Note

    Click the

    Back button 
    to exit Route Builder and return to the Routes screen.


    Route Builder Screen, labeled, with a Hublet panel open.

    • Back Button
    • Route Name
    • Latency Selector 
    • Route UpTime
    • Duration Edit Button
    • Start/Stop/Edit Action Buttons
    • + Add Hublet Button
    • Telemetry View
    • Active Hublet (indicated in blue)
    • Hublet Panel(s)
Two sample Hublet panels.

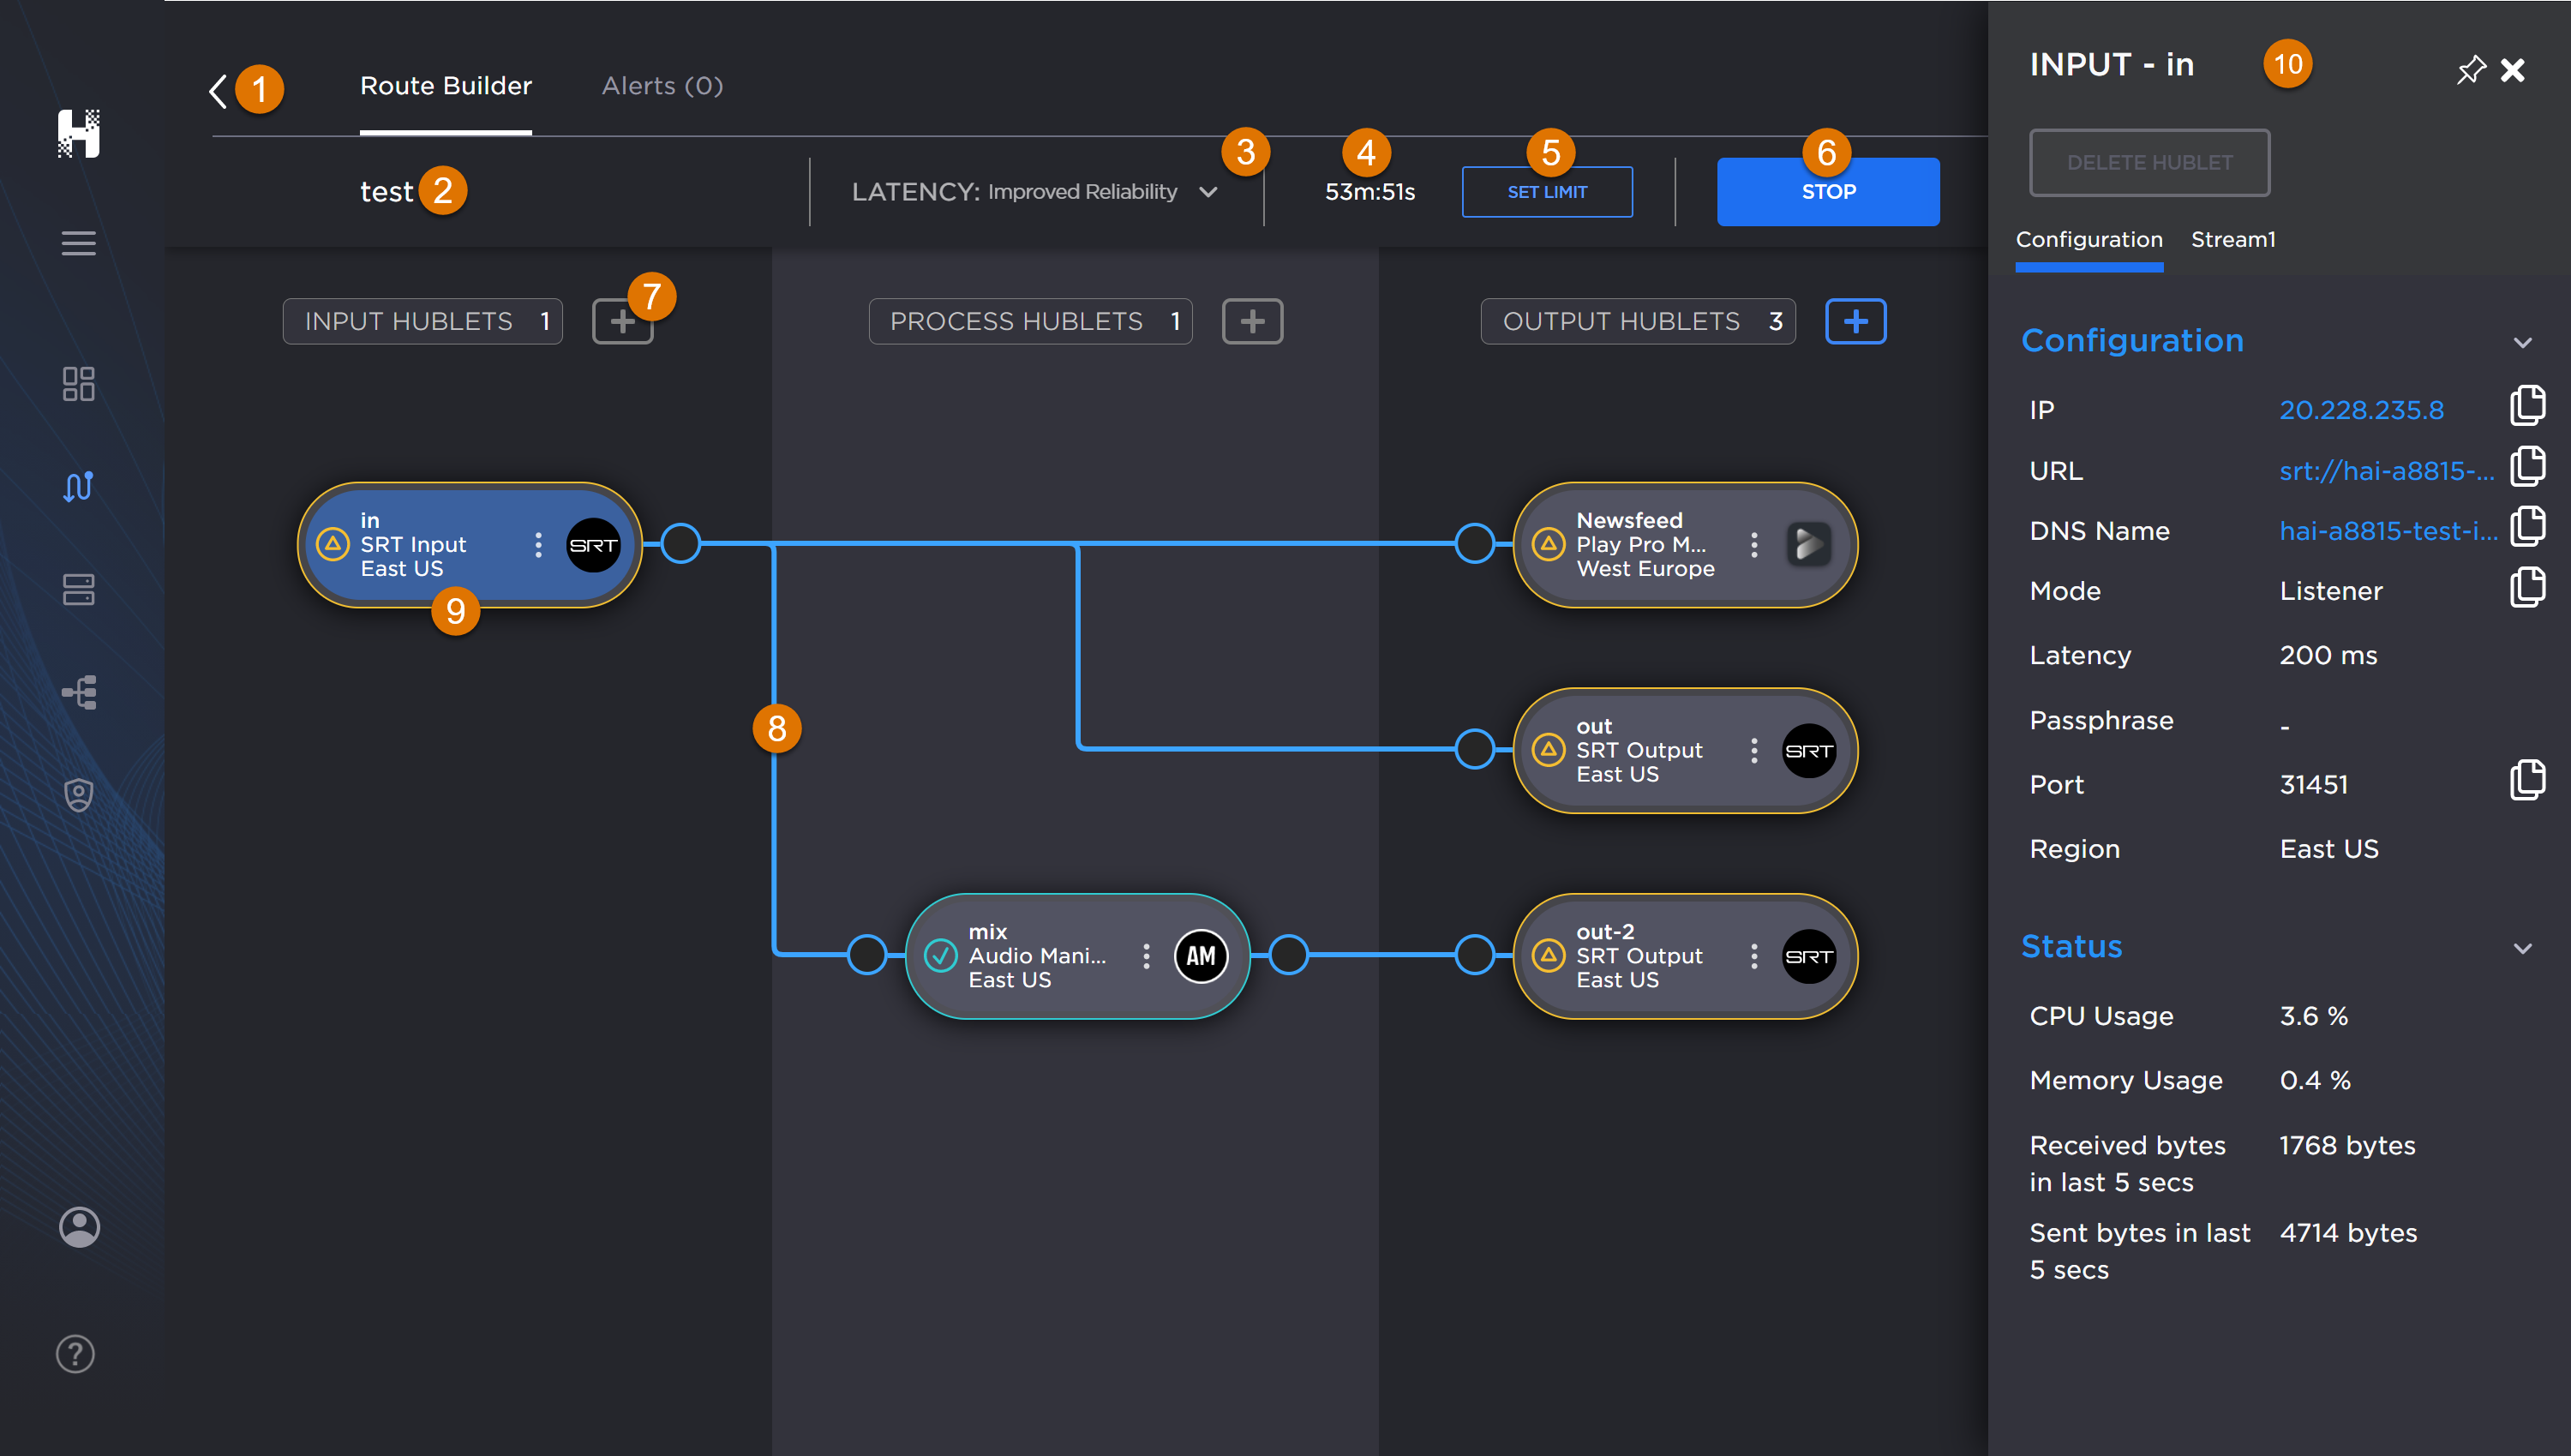
To view the Hublet Panel(s):

  1. In the telemetry pane, click the Hublet to select it. NOTE: The Hublet changes to blue when selected.
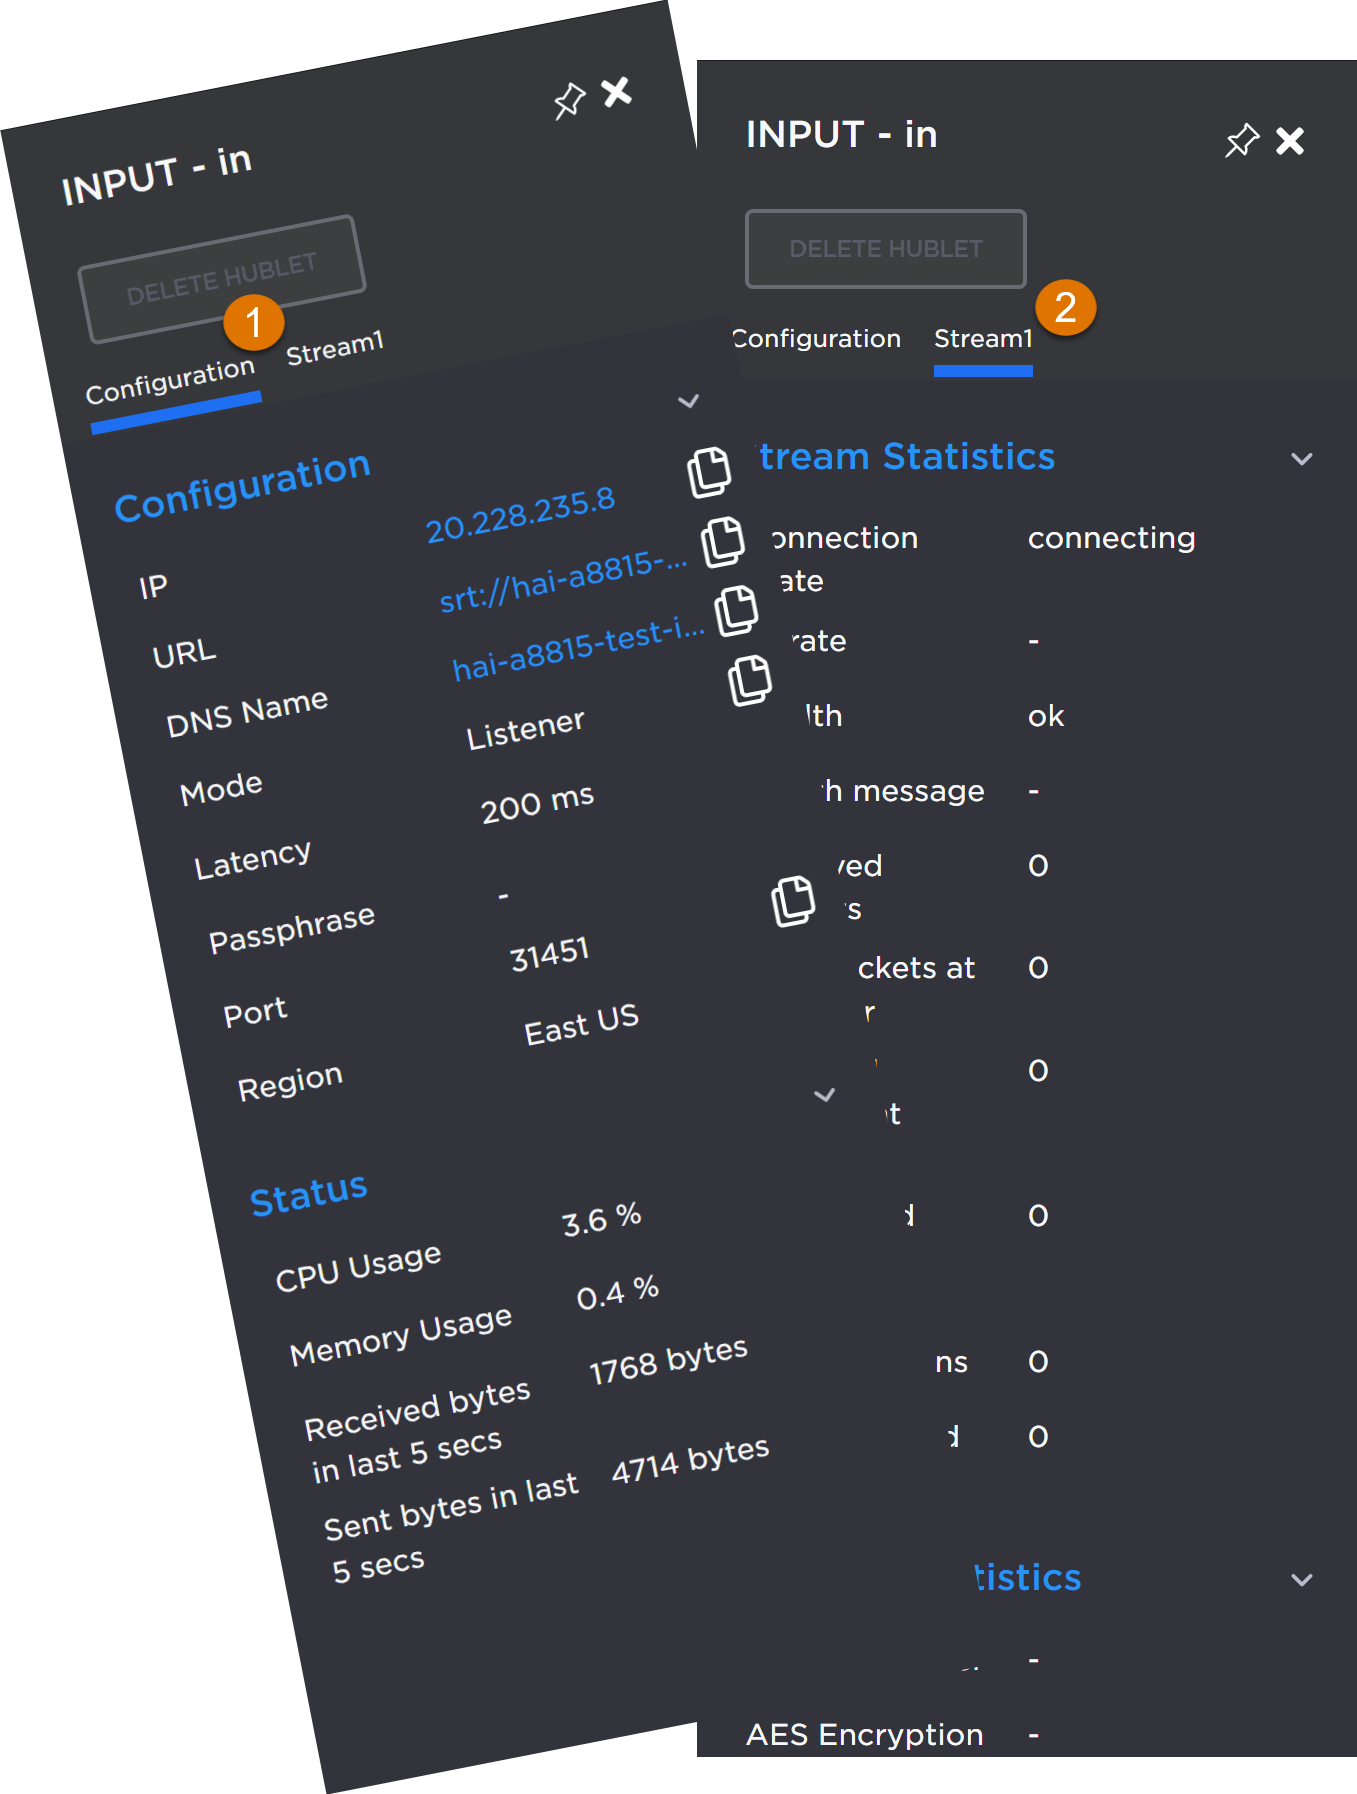
  2. When the panel slides open from the right, click the Configuration

    or Stream
    tabs as appropriate to view the information. 

    Tip

    Use the

    icon to copy the field contents to your clipboard for pasting elsewhere.

Alerts

From the Alerts

Haivision Hub can experience two types of alerts:

  • Hublet
  • Route

These alerts can be categorized as:

  • Warning
  • Critical


To view the route's alerts:

  • Click Routes on the navigation sidebar. If selection is not visible, click the
    to expand.
  • On the Routes screen, locate the route whose alerts you want to view. 

    Tip

    If there are a number of routes, use the Filtering and Sorting options above the list pane to speed locating the desired route.

  • Click the route's name in the listing to switch to the

     Route Builder view.

  • ext, at the top of the screen, click Alerts to switch to the Alerts view.

    Note

    Click the 

    Back button 
    to exit Alerts and return to the Routes screen.


Route alerts screen, labeled.

    • Alerts View
    • Alert Type Filter
    • Alert Level Filter 
    • Error Listing
    • Error Information
    • Back Button

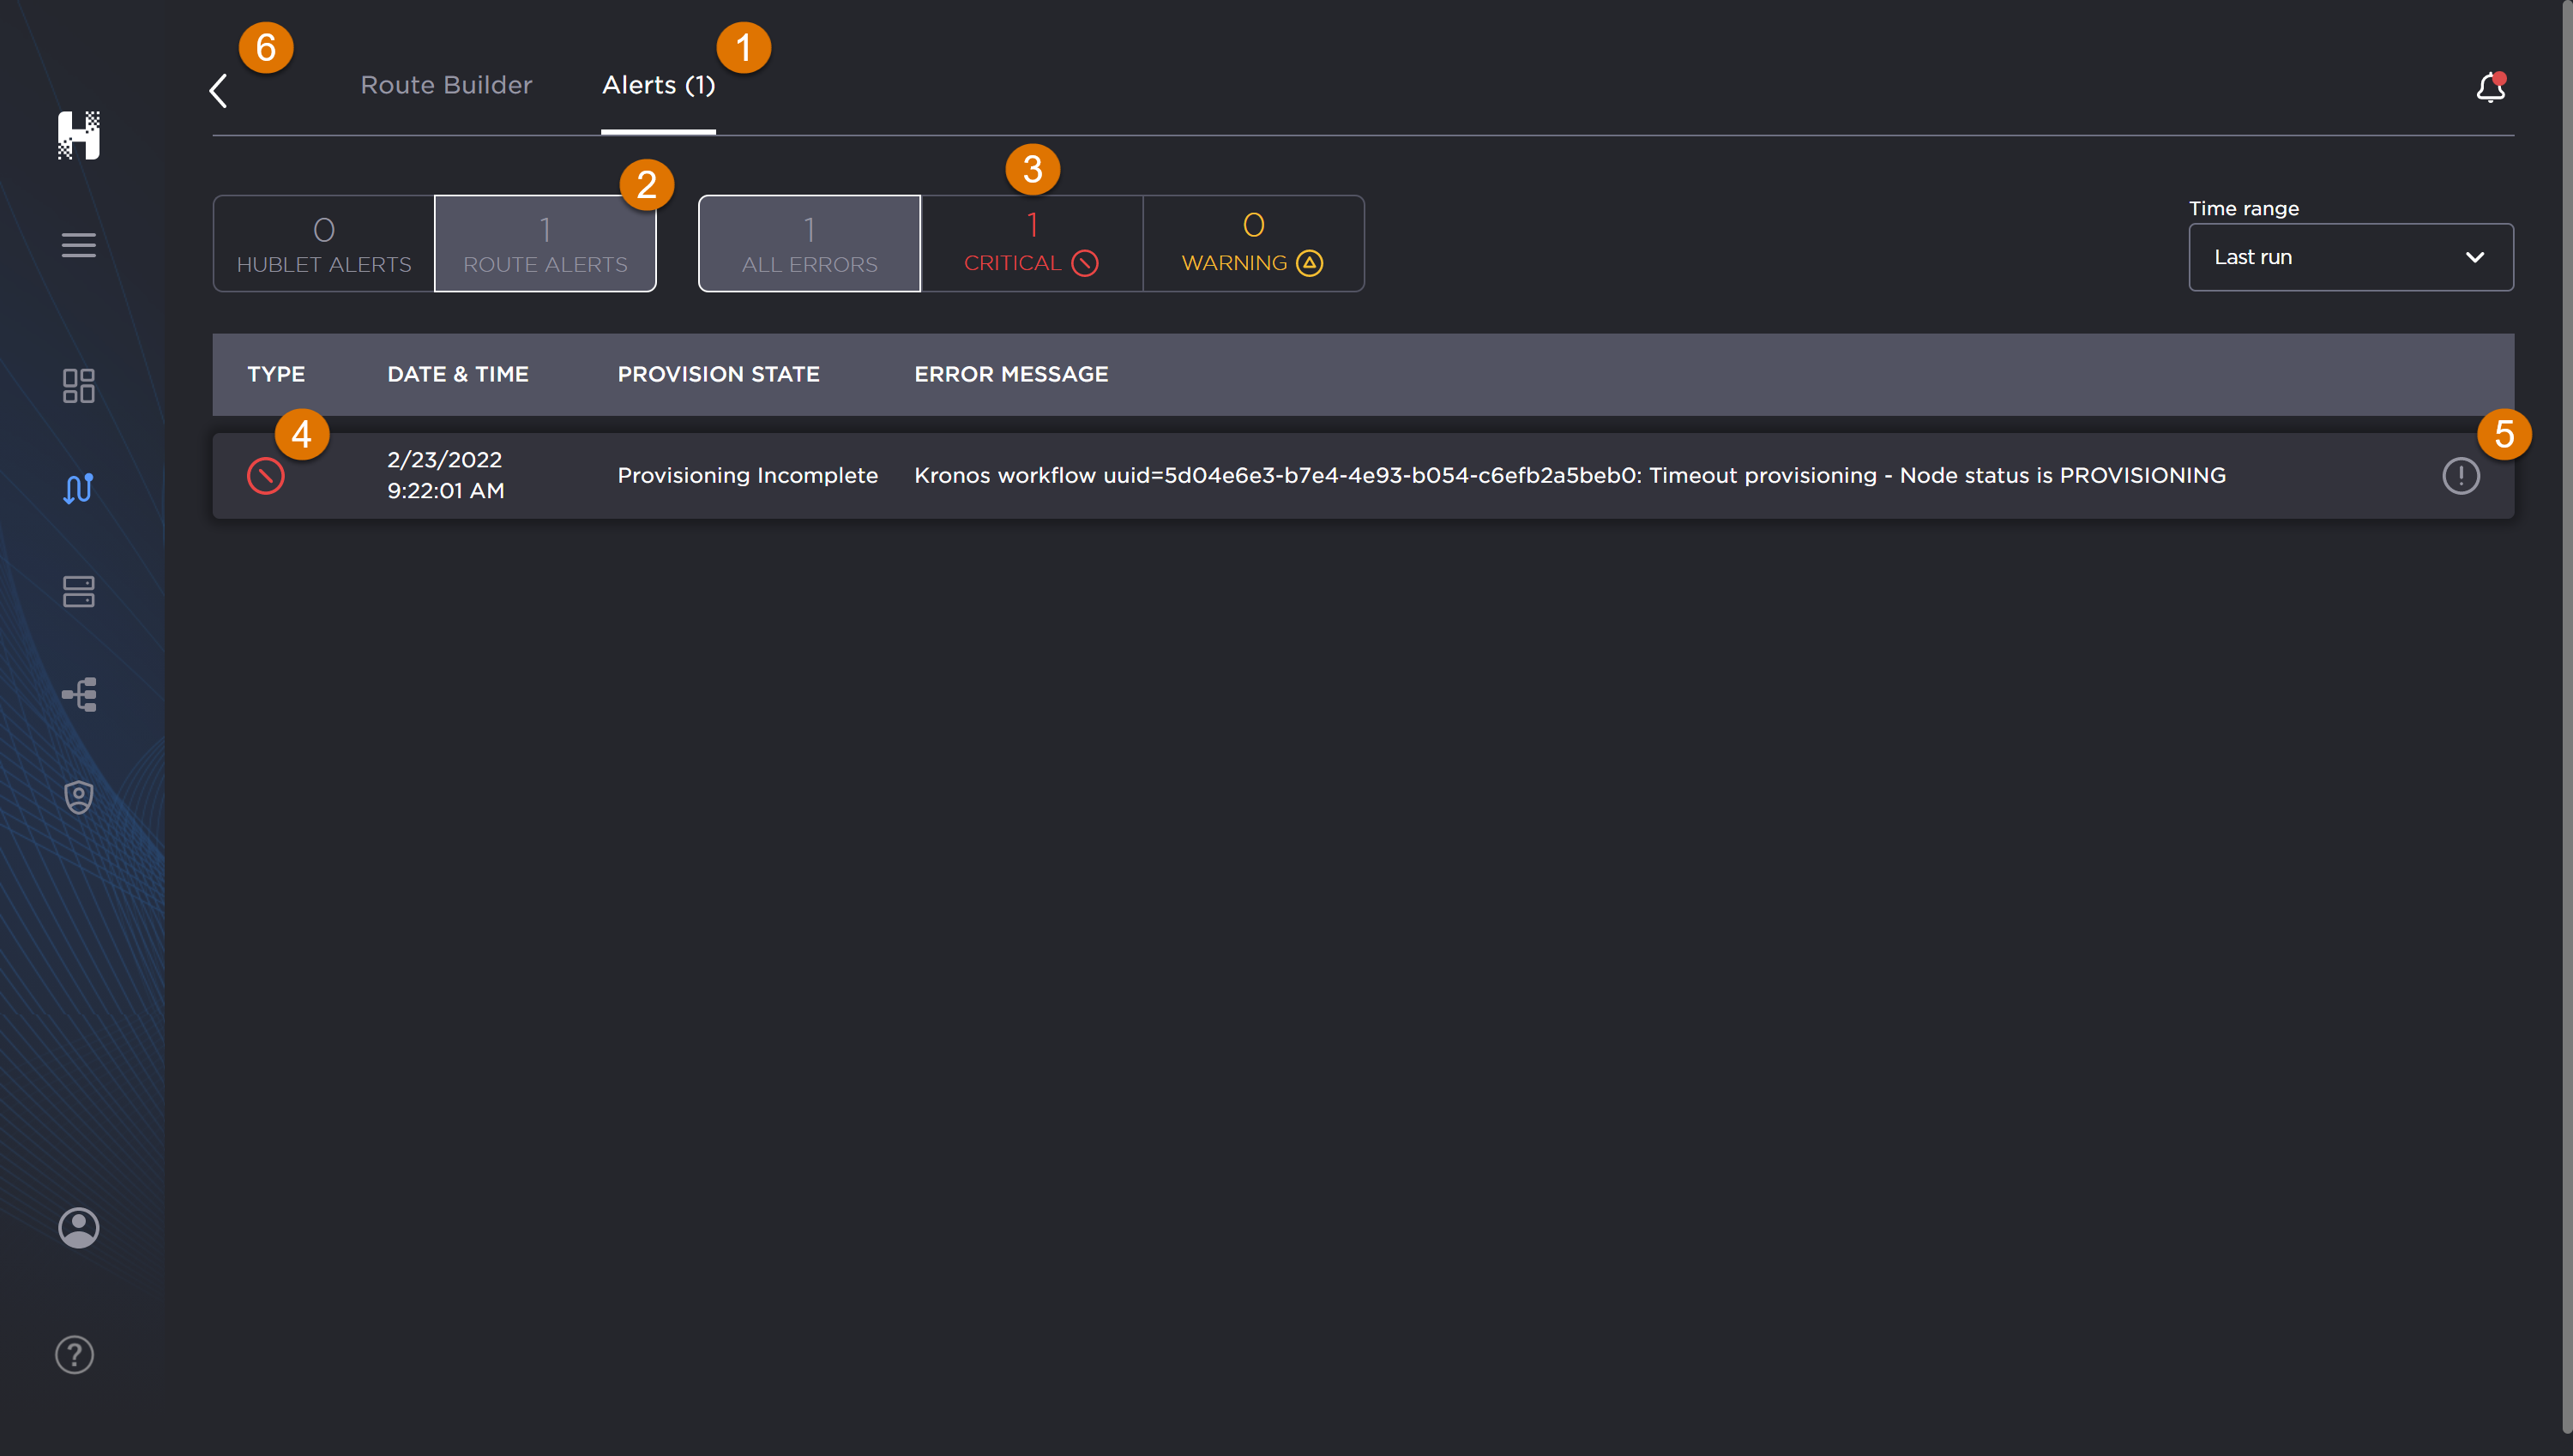
To view the Error Information:

  1. In the Alerts view, click the
    icon
    at the end of the error listing. 

    Route error message pop-up.


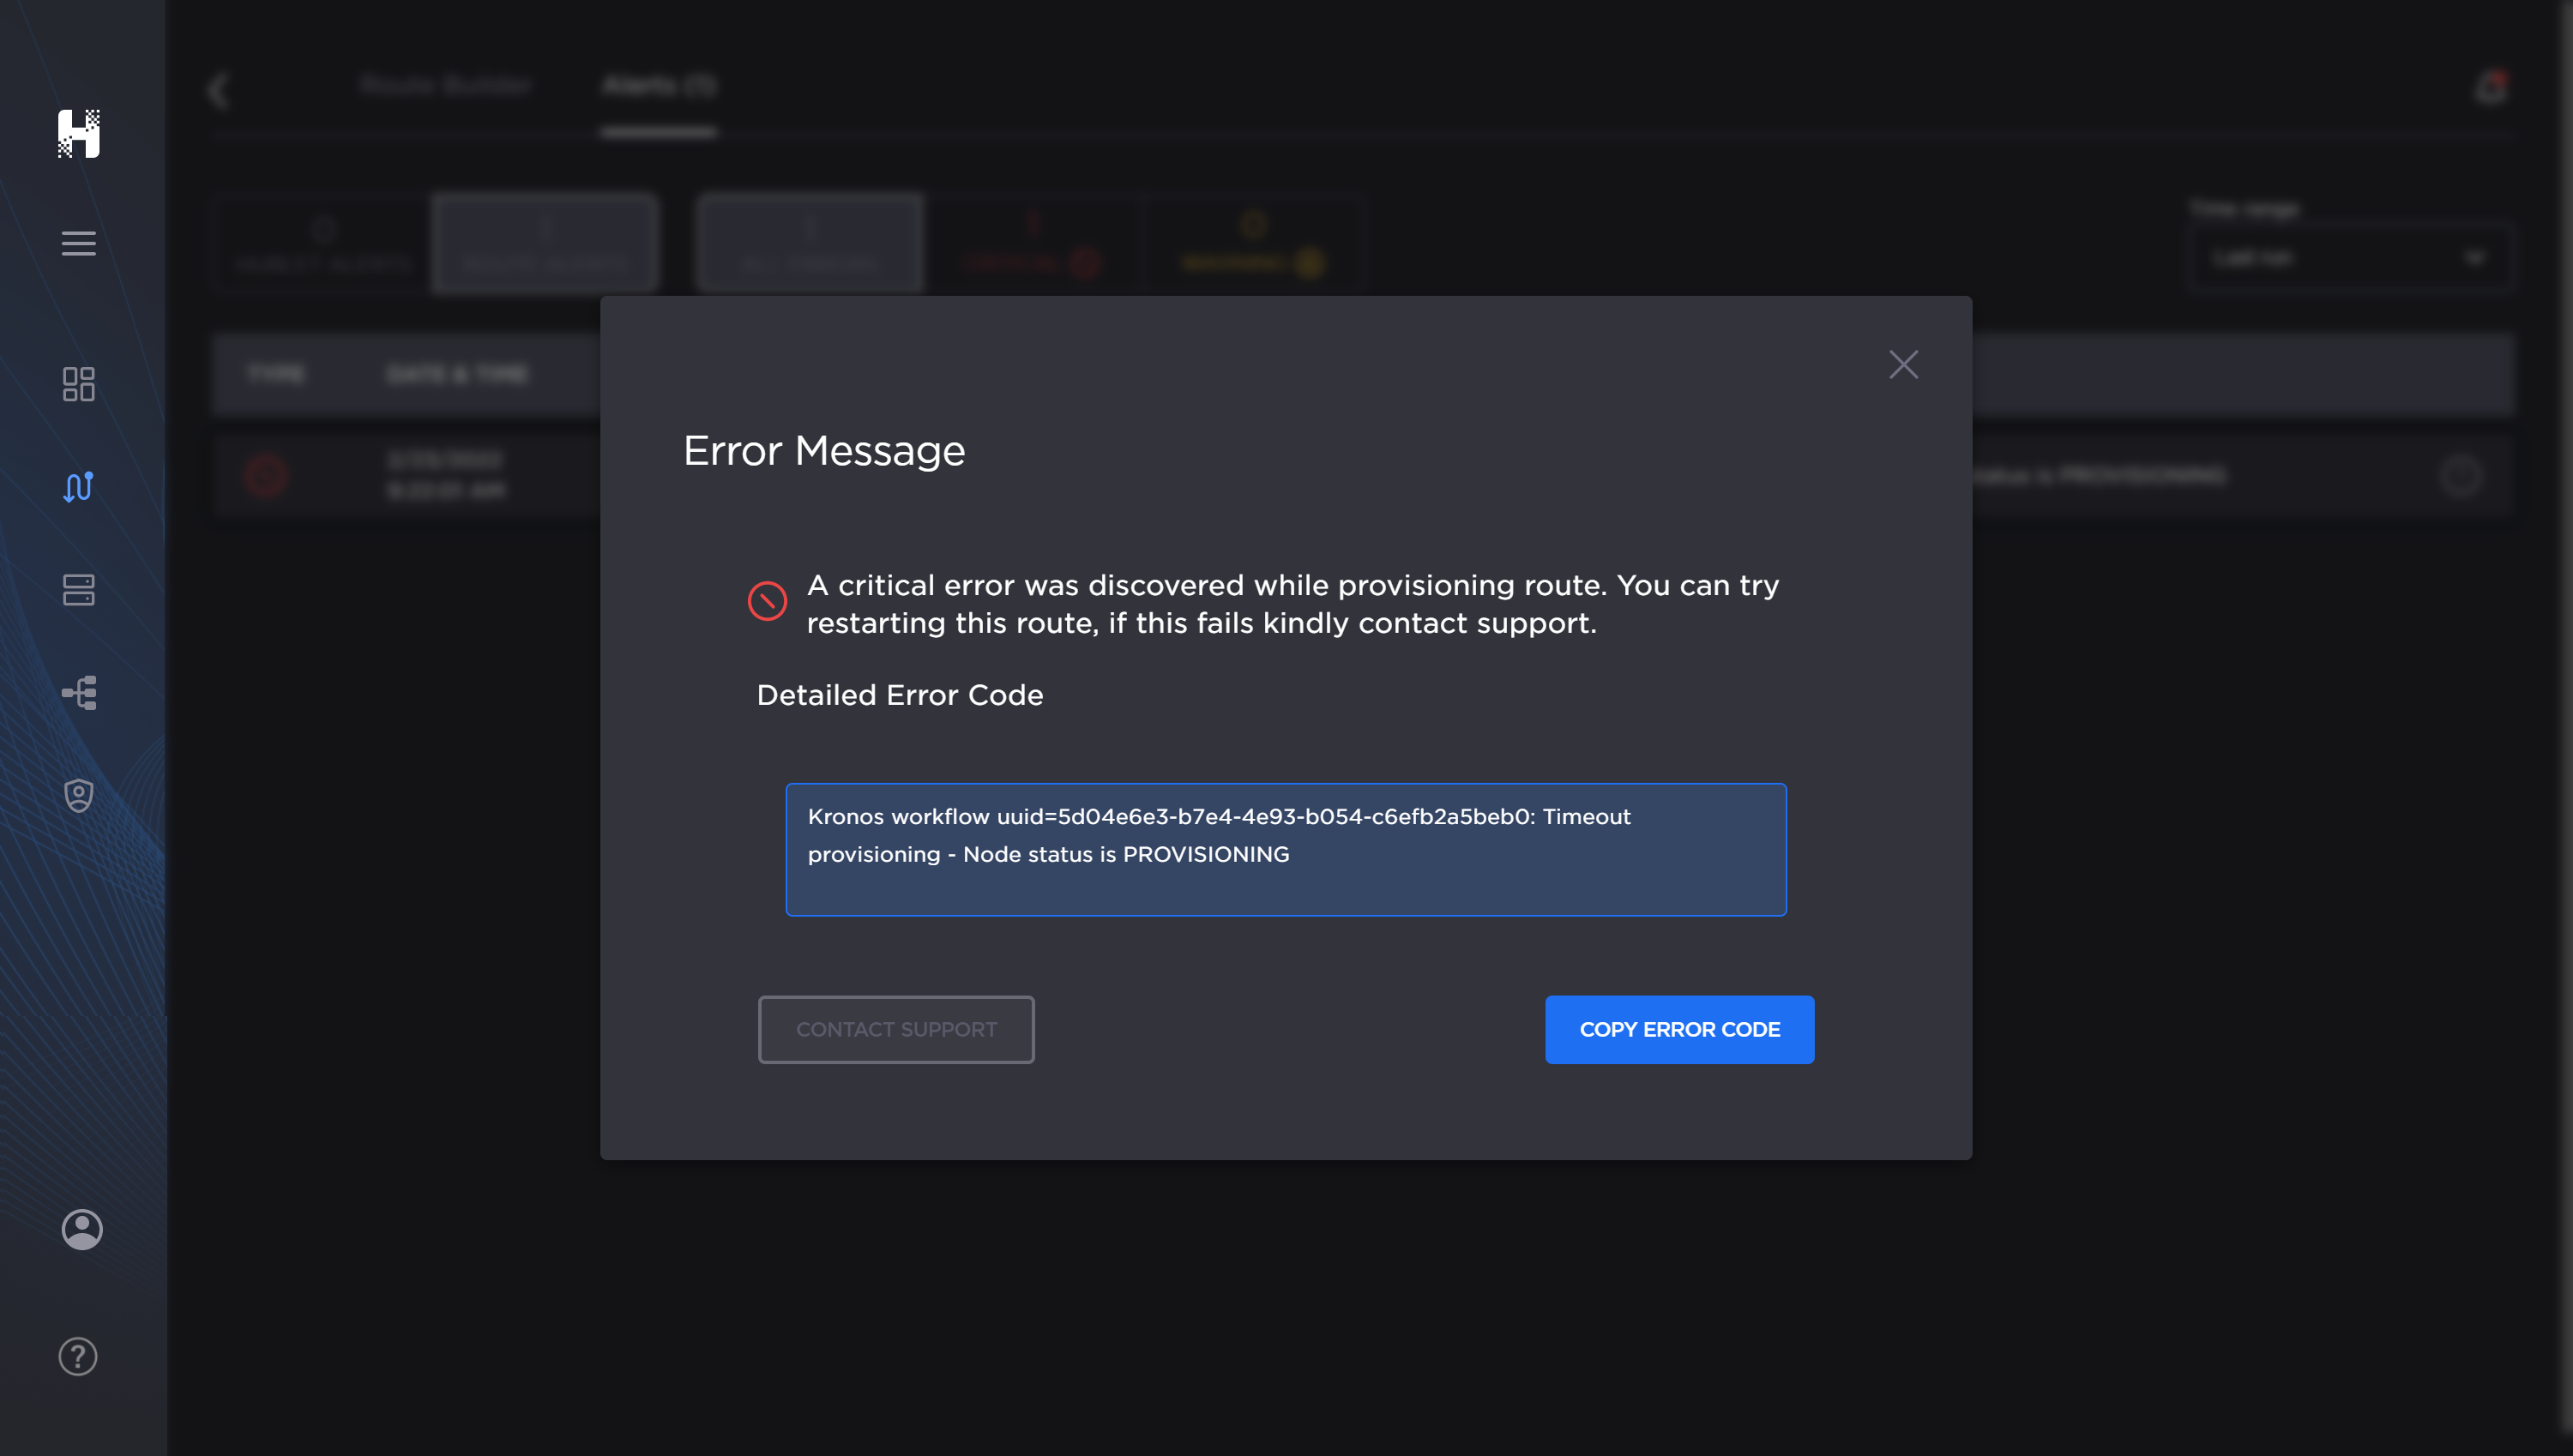
  2. Use the Copy Error Code button to save to your clipboard so that you can paste the details into emails/tickets and such.


From the Dashboard Tab


Related Topics

JavaScript errors detected

Please note, these errors can depend on your browser setup.

If this problem persists, please contact our support.